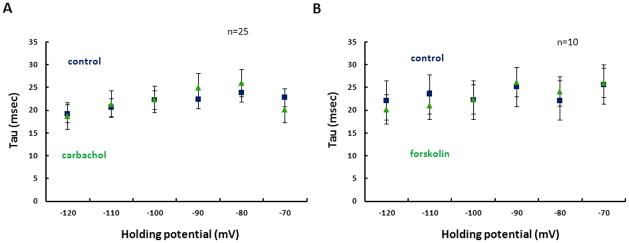
Figure 6. Time course of activation of Ih.
A. Time constants of Ih activation are shown in control (blue) and in carbachol (green) across hyperpolarized holding potentials ranging from −120mV to −70mV. B. Time constants of Ih activation are shown in control (blue) and in forskolin (green) across hyperpolarized holding potentials from −120mV to −70mV.

