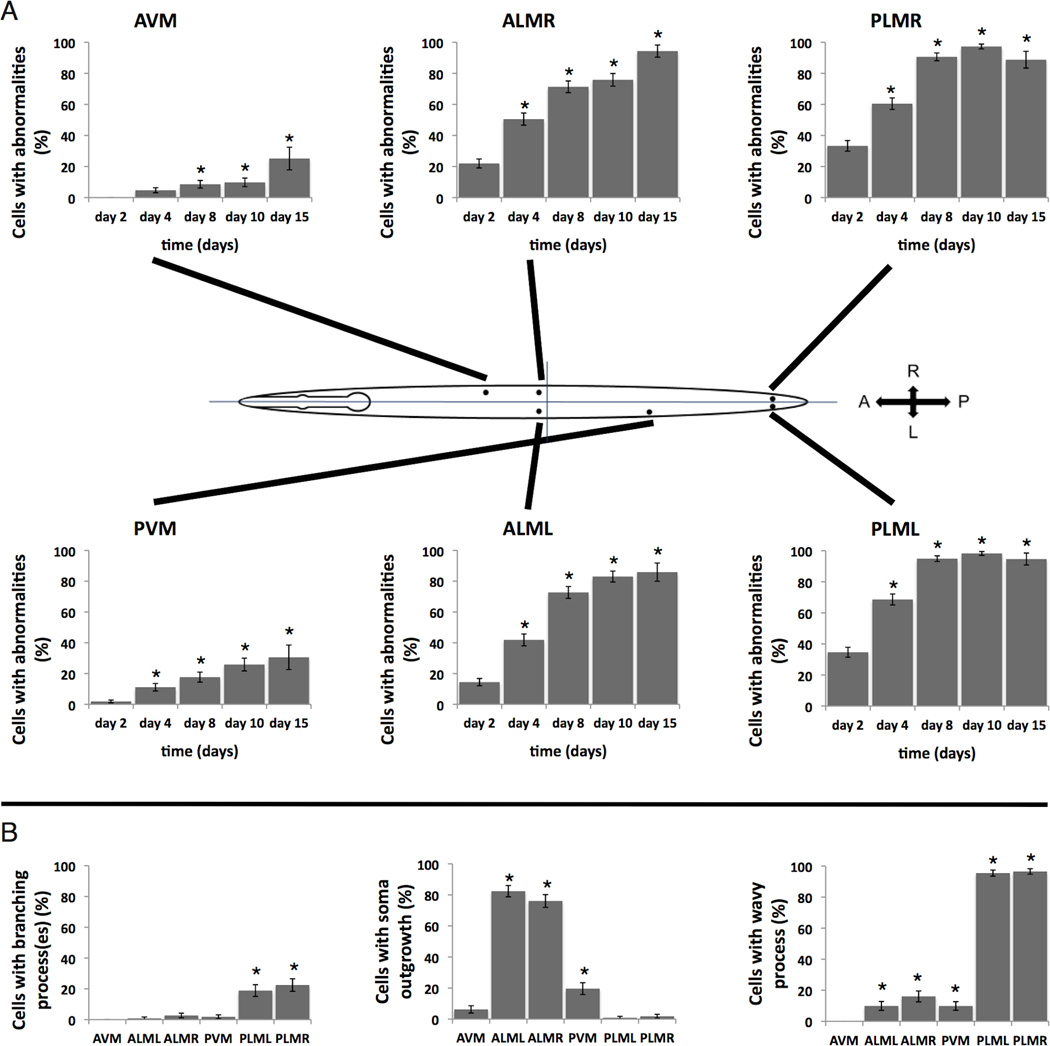
Figure 2. Morphological abnormalities in touch neurons increase with age, with the specific abnormality type differing markedly among touch neuron subtypes.
2A. The summed incidence of common abnormalities increases with age in all touch neurons, but not all touch neurons exhibit similar aging profiles. We graphed the percent of each touch neuron (ALML/R, PLML/R, AVM, PVM) that exhibited any of the three common morphological abnormalities (branched process, soma outgrowth, wavy processes) on the days indicated, 24°C. Error bars are for SD; * p<0.05, Fisher’s exact test, compared to day 2. Touch receptor soma positions are indicated by dots in C. elegans graphic; process lengths scored are similar for all touch neurons except for PVM, which was evaluated only until it runs into the ventral nerve cord (~15X shorter than PLM process length examined). Numbers of neurons of each type scored per time point were: 214 day 2; 170 day 4; 140 day 8; 112 day 10; 36 day 15. Note that although all touch neurons expressed an age-associated increase in morphological abnormalities, not all touch neurons exhibited similar aging profiles.
2B. Different touch receptor neurons exhibit different morphological abnormality types as they age. Compared are the percent of neurons of the indicated types that exhibited a branched process (left), soma outgrowth (middle), or wavy processes (right). 100 neurons were scored for each type, day 10 of adult life at 24°C, evaluation protocol as described for Figure 1E, numbers of neurons scored as in Fig. 2A; error bars indicate SD. Note striking differences in frequencies of the different abnormality types observed in ALMs vs. PLMs vs. AVM/PVM. Although the frequencies of abnormalities are lower in AVM and PVM, these neurons differ from each other in soma outgrowth and wavy process formation frequencies. * p<0.05, Fisher’s exact test, comparing to AVM scores for the indicated abnormality. We documented cell-specific comparisons at additional timepoints during adult life and find similar trends on other days (data not shown). Studies presented were carried out in the presence of 51ug/ml FUDR in plates to prevent progeny production. We found no statistical difference in ALM and PLM abnormalities if we used 51ug/ml FUDR vs. animals not reared on the drug but picked away from offspring (data not shown); we did note a slight increase in abnormalities in AVM and PMV at this concentration FUDR, underscoring cell type differences. These changes remained rare, however.

