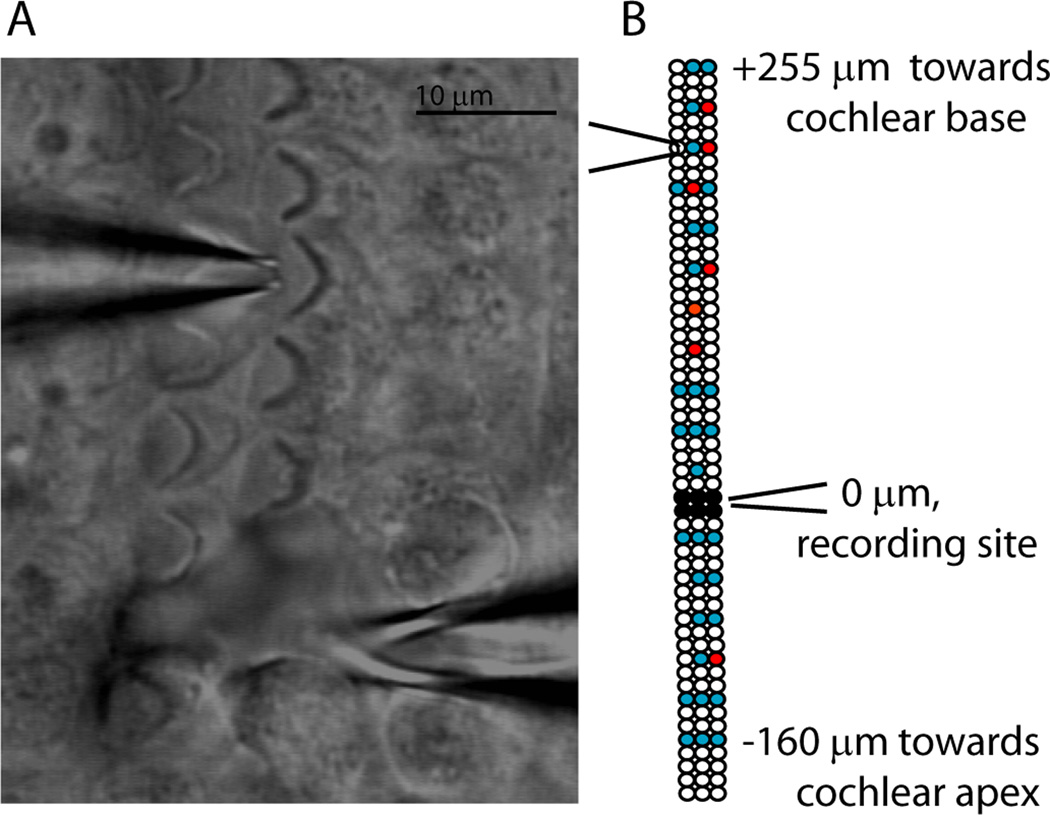
Figure 1.
Procedure. A. Differential interference contrast image of the experimental preparation. Stereociliary bundles of the OHCs are visible. Modiolus is to the left, out of view. Electrode (bottom, tip below plane of focus) patched onto a type II afferent dendrite spiraling under OHCs. Puff pipette (top) positioned at the apical pole of a targeted OHC. Scale bar = 10 microns. B. Exemplar map of OHCs targeted by puffer pipette while recording from a post-synaptic type II dendrite (different scale than A). Three rows of circles indicate three rows of OHCs. Black circles: OHCs removed to expose dendrites at recording site. White circles: unstimulated OHCs. Blue circles: Stimulated OHCs that did not evoke postsynaptic EPSCs. Red circles: Stimulated OHCs that evoked EPSCs in the postsynaptic type II afferent.

