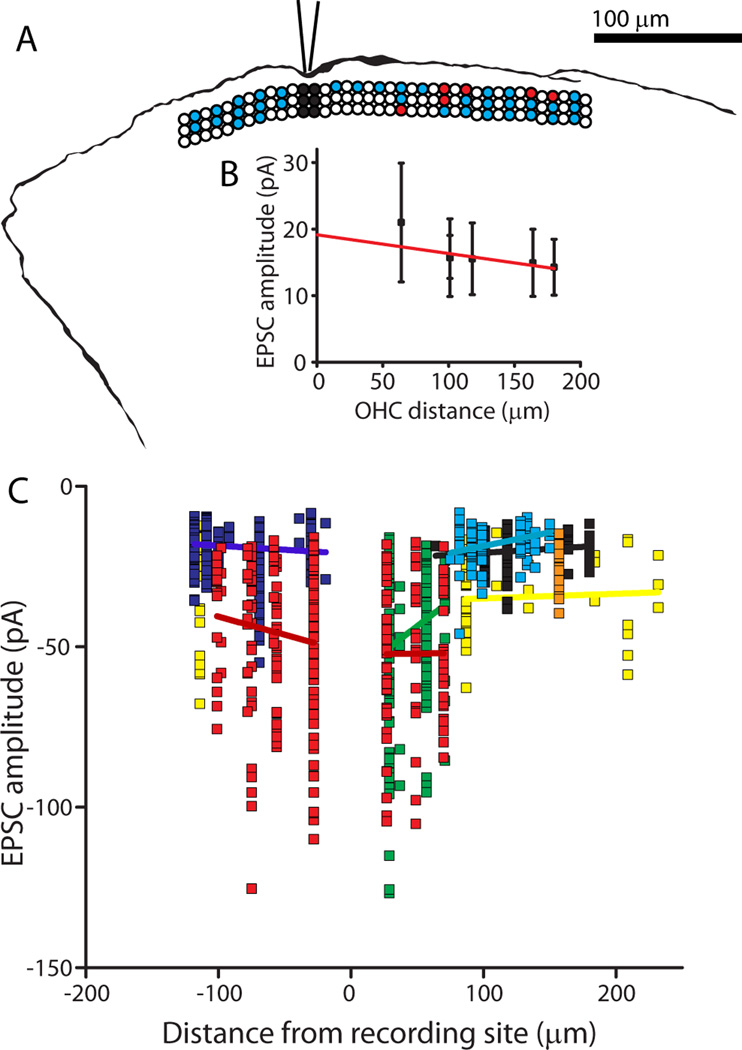
Figure 6.
Mapping of functional synaptic inputs to type II afferent dendrites. A. Tracing of AlexaFluor 488 hydrazide fill from a type II afferent from which recordings were made while stimulating OHCs. Overlay: Diagram illustrating position of stimulated OHCs, same scale as fiber tracing. Three rows of circles indicate three rows of OHCs. Black circles: OHCs removed to expose dendrites at recording site. White circles: unstimulated OHCs. Blue circles: Stimulated OHCs that did not evoke postsynaptic EPSCs. Red circles: Stimulated OHCs that evoked EPSCs in the postsynaptic type II afferent. B. Amplitude of EPSCs evoked from single OHCs by distance from the recording electrode, same experiment as shown in (A). EPSC data aligned with map in (A). Red line indicates linear fit of data. C. Scatterplot of EPSC amplitude plotted by distance from the recording site in 8 type II fibers. Each color represents EPSCs recorded from a different type II dendrite with linear regression in same color for each data set.

