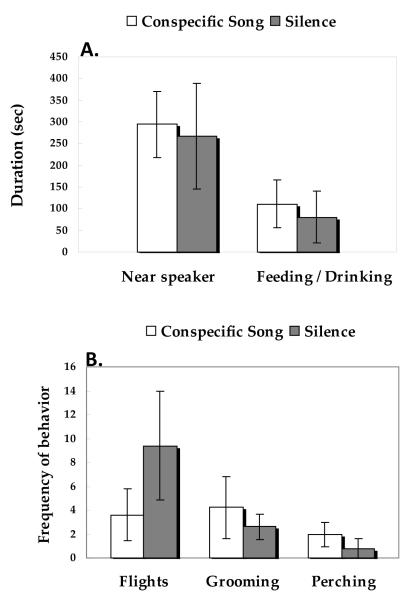
Figure 4.
Panel A shows the comparison between the amount of time spent near the speaker and the time spent feeding or drinking between song-exposed (N = 11) and silent-exposed (N = 5) female zebra finches. A bird was considered to be spending time near the speaker if she moved to the same side and corner as the speaker and within approximately 15 cm. Panel B shows the comparison of the number of flights (either to a new perch or to the ground), grooming behaviors (bill wipes, preening) and movements across the perch between song-exposed and silent-exposed female zebra finches.

