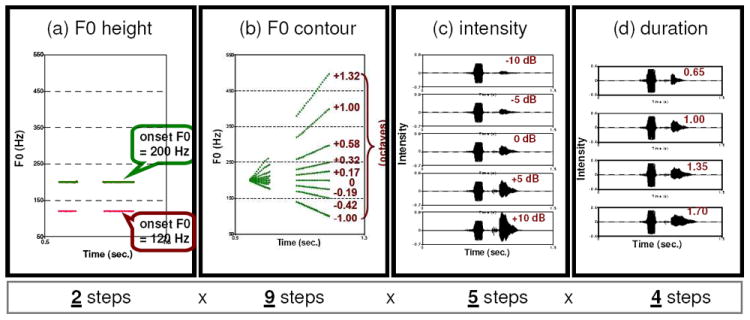
Figure 2.

Illustrations of acoustic dimensions that were manipulated orthogonally, resulting in 360 tokens. Panels (a) through (d) display the steps specific to each acoustic dimension, i.e., F0 height, F0 contour, peak intensity ratio, and duration ratio, respectively. The number of steps for each dimension is also indicated below each panel. This figure was reproduced from Peng et al. (2009), with permission from the publisher.
