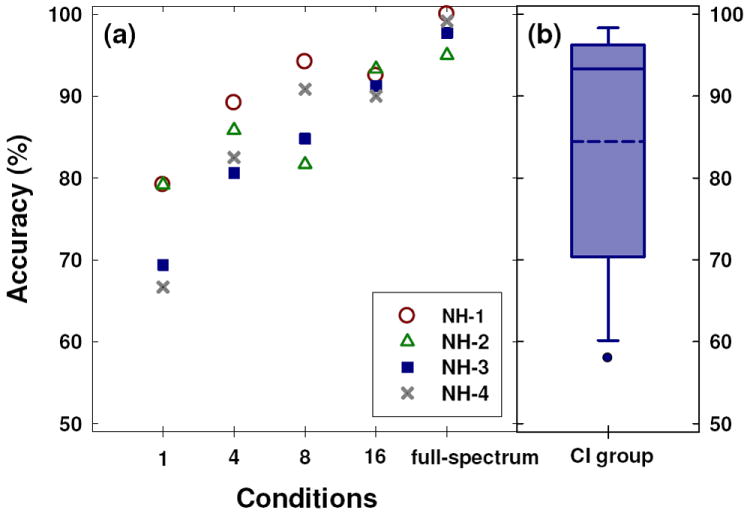
Figure 3.

Question-statement identification accuracy with naturally-uttered stimuli, by NH and CI listeners. Panels (a) and (b) display the data for NH and CI listeners, respectively. In Panel (a), the individual data of four NH listeners are shown with different symbols. The x-axis for Panel (a) displays the spectrally degraded (1-, 4-, 8-, and 16-channel) and the full-spectrum conditions. For Panel (b), the mean and median are displayed by the dotted and solid lines across each box, respectively. For both panels, the y-axis displays the overall identification accuracy. The upper and lower bounds of each box represent the quartiles, the whisker away from the box bounds showed the ± 1.25 S.D. of the mean, and the filled circles represent the 5th and 95th percentiles bounds, if they are outside of the end of whisker.
