
Figure 4.
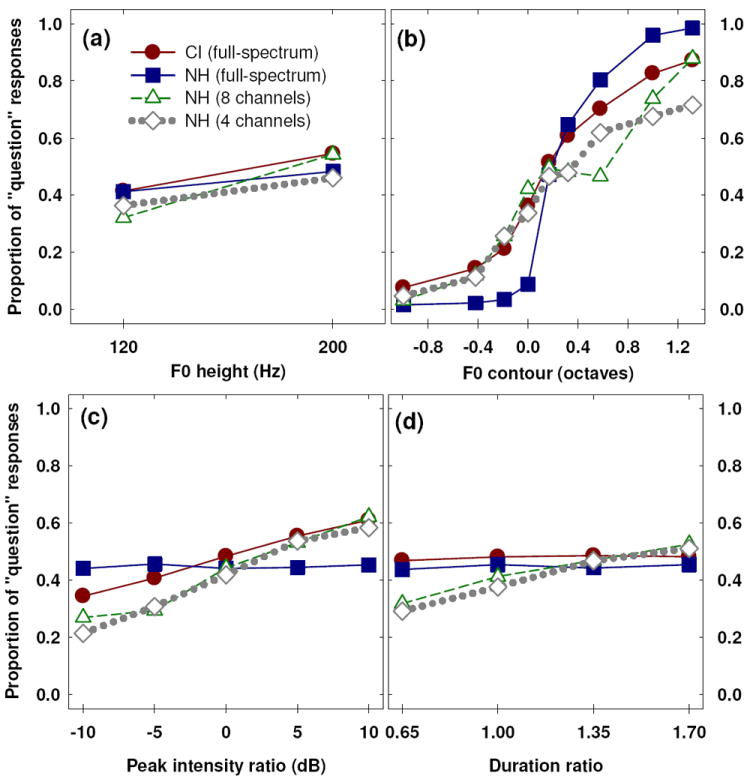
Group mean proportions of question judgments as a function of the manipulation in each acoustic dimension. Panels (a) through (d) display the data for the acoustic dimensions, i.e., F0 height, F0 contour, peak intensity ratio, and Duration ratio, respectively. The x-axis in each panel indicates the steps of the manipulation specific to each acoustic parameter; the y-axis indicates the proportions of question judgments. The data for two groups (CI vs. NH), as well as for different listening conditions (full-spectrum, 8- and 4-channel) are shown with different symbols; data points at different steps are linked with a solid line (for the full-spectrum condition) or a dashed line (for the 8- and 4-channel conditions).