
Figure 6.
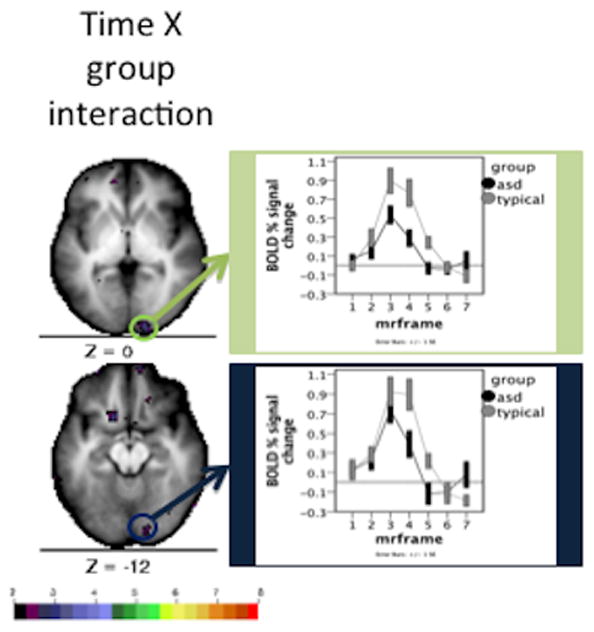
Time courses and statistical Z map for time course X group interaction using a quality control low Z value threshold. The map depicts the uncorrected Z values derived from the time course X group interaction. The mean time course for Simplex Autism (dark) and typical (light) cohorts are depicted for each of the chosen ROIs. Error bars represent 1 standard error of the mean. Color bar ranges from black (Z = 2) to red (Z = 8).