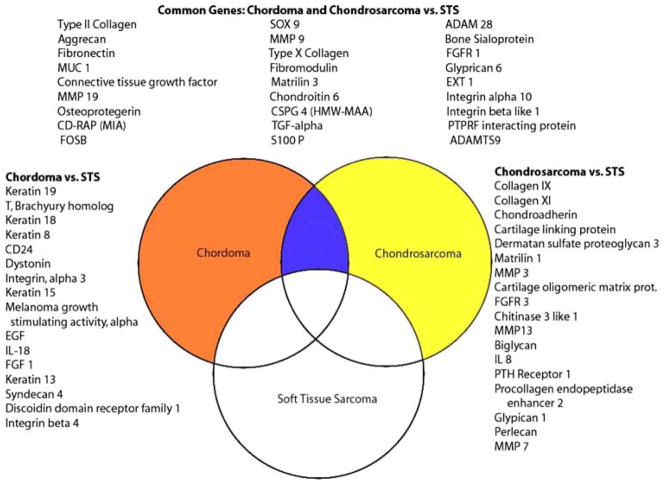
Fig. 2.
This Venn diagram demonstrates genes that show >2-fold change in chordoma (orange circle) and chondrosarcoma (yellow circle) relative to soft tissue sarcomas (white circle). The list on the left demonstrates selected genes that are up-regulated in chordoma relative to soft tissue sarcoma (STS). The list on the right demonstrates selected genes that are up-regulated in chondrosarcoma. The three columns at the top represent selected genes that are up-regulated in both chordoma and chondrosarcoma relative to soft tissue sarcoma

