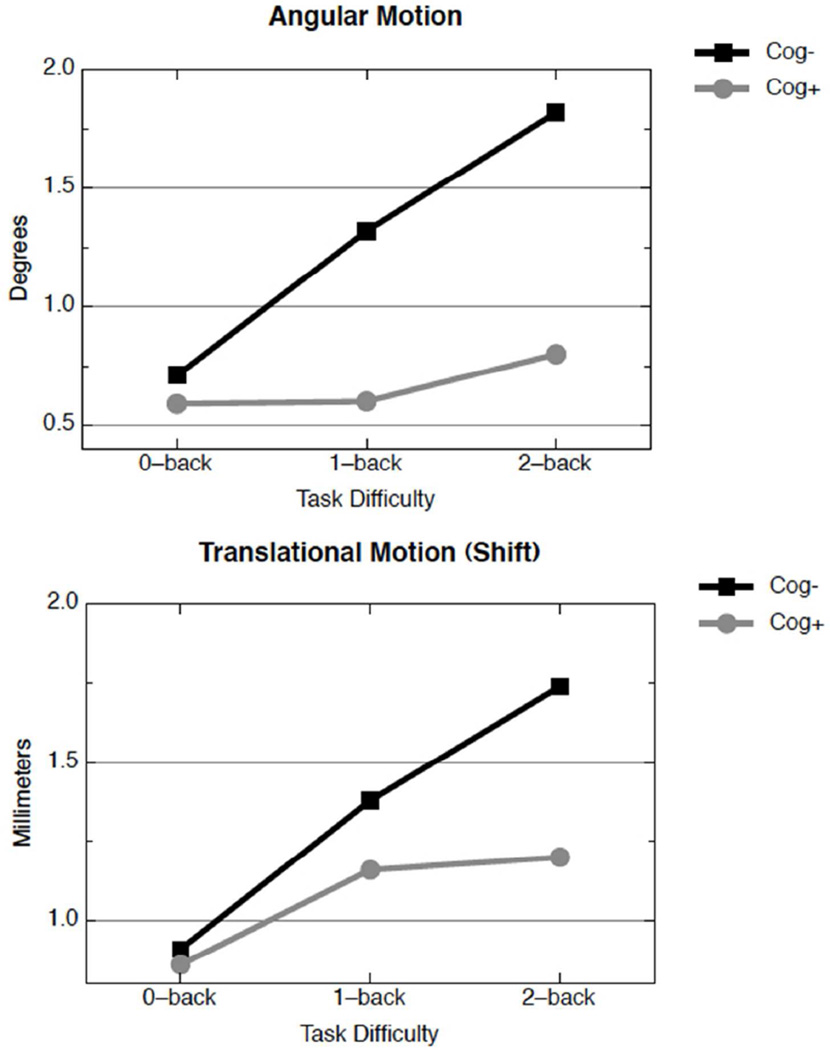
Figure 1.
Angular (upper panel) and translational motion (lower panel) in the MS sample, divided into cog− (black squares) and cog+ subjects (gray circles). For angular motion, the cog− group differed between 0-back and 1-back (d=0.64, p<0.05) and between 0-back and 2-back (d=0.096, p<0.01); the cog+ group differed between 0-back and 2-back only (d=0.66, p<0.05). For translational motion, the cog− group differed between 0-back and 1-back (d=0.80, p<0.01), 1-back and 2-back (d=0.61, p<0.05), and between 0-back and 2-back (d=1.20, p<0.001); the cog+ group differed between 0-back and 2-back only (d=0.54, p<0.05).

