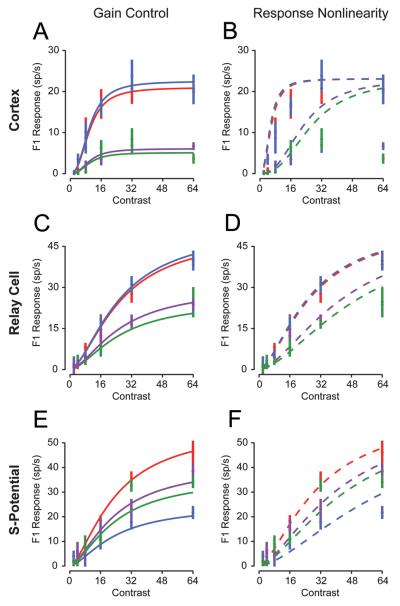
Figure 3. Comparison of the gain control and response nonlinearity models.
(A) Contrast response curves were fit to functions with gain-control model fits for the example V1 neuron in Fig. 2. (B) The contrast responses were fit with the response-nonlinarity model. (C,D) Same as (A, B) for an LGN relay cell. (E,F), Same as (A,B) for the s-potential recording.

