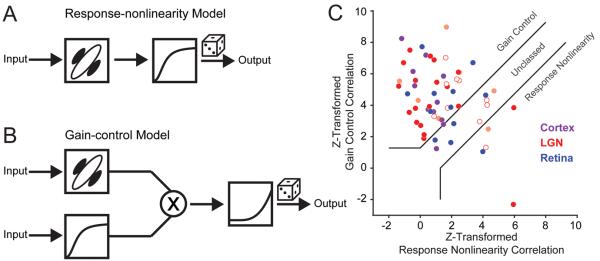
Figure 4. Models describing contrast saturation in the visual pathway and correlation analysis.
(A) Response-nonlinearity model has a single final nonlinearity that depends on stimulus strength and scales contrast saturation rate (as in Fig. 1E). (B) Gain control model has an independent mechanism invariant of stimulus strength and scales peak response amplitude with stimulus strength (as in Fig. 1F). (C). Scatterplot of Fisher z-transformations of partial correlations between the actual responses and those predicted from the gain control model (ordinate) and from the response nonlinearity model (abscissa). Each point indicates a different cortical cell (purple), LGN relay cell (red-open Y, closed X, lightly shaded, not X/Y classified) and RGC s-potentials (blue). Following Movshon et al. (1986) and Smith et al. (2005), solid lines indicate basis for classification.

