Figure 3.
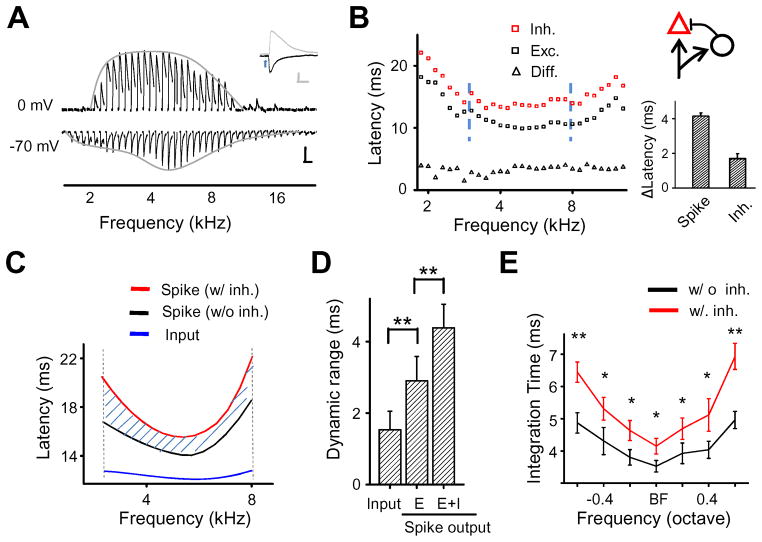
Contribution of cortical inhibition to spike latency tuning. A, Average inhibitory (upper) and excitatory (lower) responses to 70dB tones of various frequencies recorded in an example neuron. Each small trace represents the response to a tone. Gray curve is the fitted envelope of peak response amplitudes (i.e. tuning curve of synaptic strength). Scale: 50pA, 100ms. Inset, enlarged sample inhibitory and excitatory responses to the BF tone. Arrow points to the onset of the tone. Scale: 50pA and 25ms. B, Frequency tuning of excitatory input latency (black), inhibitory input latency (red) as well as their difference (gray) for the same cell. Blue dashed vertical lines mark the frequency range for spike response. Right inset, schematic depiction of the feedforward inhibitory circuit (black circle represents an inhibitory neuron) connecting to a L4 pyramidal neuron (triangle), and comparison of onset latency of the first spike and inhibition relative to the onset of excitation (ΔLatency). C, Smoothed frequency tuning curves of synaptic input latency (blue), spike latency derived from the excitatory input only (black) and that from the total synaptic input (red), within the spiking frequency range. D, Average dynamic range of excitatory input latency, of spike latency in the presence of excitatory input only (“E”) and in the presence of both excitatory and inhibitory inputs (“E+ I”). Bar = SD. **, p<0.01, paired t-test, n = 14 cells. E, Average tuning curves of integration time derived from the excitatory input only (black) and of that from the total synaptic input (red). Whiskers = SE. * p<0.01, ** p<0.001, paired t-test, n = 14.

