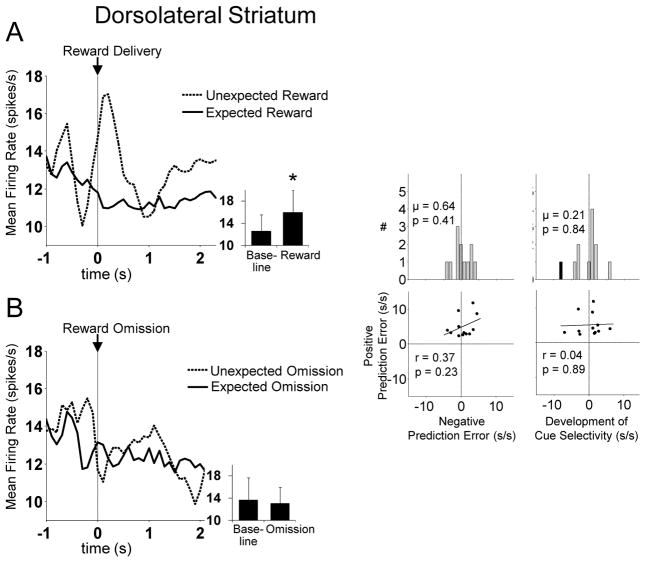
Figure 10. Dorsolateral Striatal FFNs Fail to Show Reward Prediction Errors.
Left panel shows average firing rate of dorsolateral striatal FFNs that respond significantly more to unexpected than expected reward, aligned to reward delivery (A) or omission (B) (n = 12, 8% of all FFNs recorded in dorsolateral striatum). Inset shows average firing rate during the baseline epoch versus that during reward or reward omission (baseline epoch was the 0.5s immediately before the prediction error epoch). Asterisk indicates p < 0.01 vs. baseline. Right panel shows the other criteria for reward prediction errors for each neuron in this population. Although this population shows a phasic response to unexpected reward, it does not meet any of the other criteria for RPEs. Black bars indicate neurons that were significantly selective on a trial-by-trial basis.

