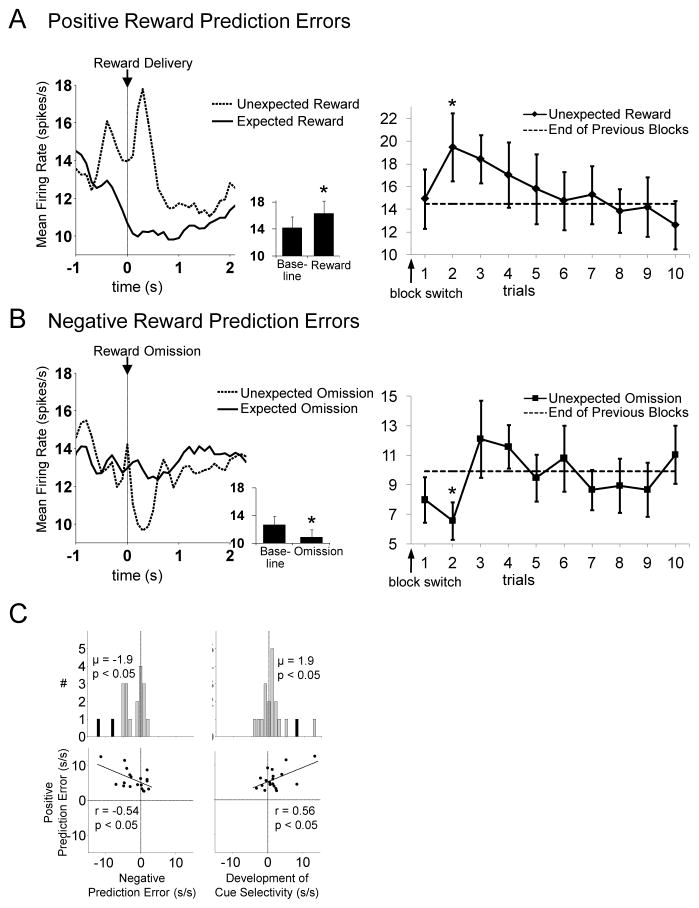
Figure 5. A Subset of Posterior Dorsomedial FFNs Signal Reward Prediction Errors.
Left panels show average firing rate of FFNs that respond significantly more to unexpected than expected reward, aligned to reward delivery (A) or omission (B) (n = 19, 10% of all FFNs recorded in posterior dorsomedial striatum). Inset shows average firing rate during the baseline epoch versus that during reward or reward omission (baseline epoch was the 500 ms immediately before reward delivery or omission). Asterisks indicate p < 0.01 vs. baseline. Right panels show the average peak (A) or minimum (B) firing rate during the RPE epoch on each trial after a block switch. For both positive and negative RPEs, activity was significantly different from average activity on previous blocks (solid lines) only on the second trial of the new block. Panel C shows the other criteria for reward prediction errors for each neuron in this population. The population fired significantly less during unexpected than expected reward omission (negative prediction errors) and developed significant cue-selectivity to odor cues that came to predict reward later in the block. These difference scores were each significantly correlated with the positive prediction error difference score. Black bars indicate neurons that were significantly selective on a trial-by-trial basis. Positive and negative prediction error scores were the difference in mean firing rate between first 5 trials and last 15 trials, in epochs and blocks with unexpected reward delivery or omission (see Figure 1 for timing of these epochs). Cue selectivity score was the difference in mean firing rate between the high value-associated cue and low value-associated cue in the first 3 forced-choice trials subtracted from the same difference in the last five forced-choice trials. Firing rate shown in left panels A and B show average across the two trials with the biggest RPEs (trials 2 and 3 for positive RPEs, trials 1 and 2 for negative RPEs).

