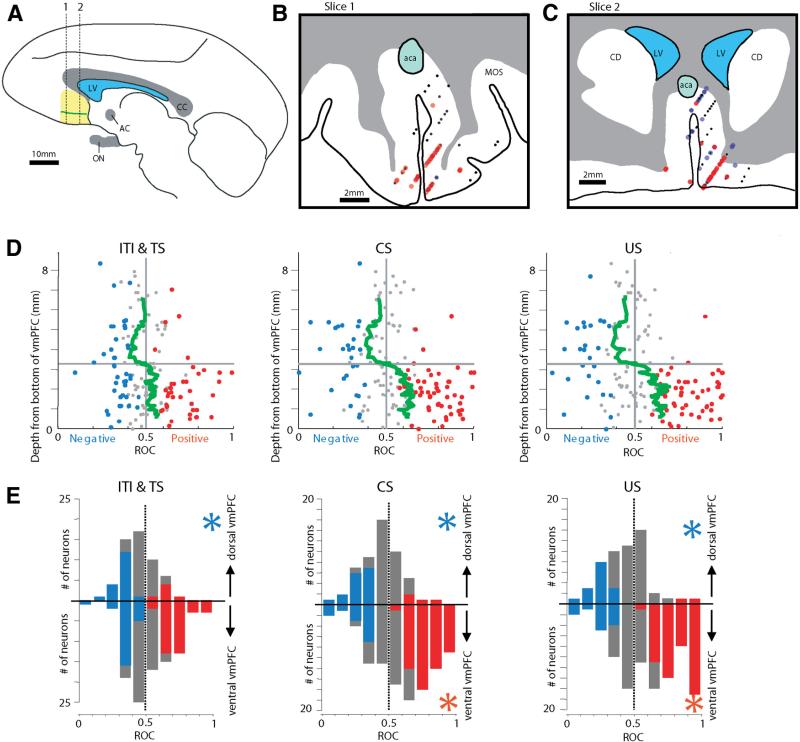
Figure 3.
Regionally differential encoding of appetitive and aversive blocks within vmPFC. A, Single neuronal activity was recorded in the vmPFC (yellow area) from 7 to 15 mm anterior to the anterior commissure (AC). The green line demarcates the dorsal and ventral vmPFC defined physiologically (see D). CC, Corpus callosum; ON, optic nerve; LV, lateral ventricle. This drawing is based on a parasagittal MR image through the vmPFC. B, C, Recording sites of positive neurons (red dots) and negative neurons (blue dots) plotted on two coronal sections. The positions of the sections are indicated by dotted lines in A. Small black dots indicate non-modulated neurons. The anterior recording sites (12–15 mm from AC) are included in B; the posterior recording sites (7–11 mm from AC) are included in C. CD, Caudate nucleus; aca, anterior cerebral artery; MOS, medial orbital sulcus. D, The magnitudes of the differential encoding of appetitive and aversive blocks in individual neurons (abscissa) plotted against the depth from the bottom of the vmPFC (ordinate). The magnitudes of the differential block encoding are expressed as ROC areas (see Materials and Methods). They are shown separately for three epochs: ITI and TS (neuronal activity compared in the last 3 s of ITI and first 500 ms of the TS period), after CS (neuronal activity compared during the entire CS epoch; data pooled for 100 and 50% CSs), and after US (neuronal activity compared in the first 1 s after US). The green line indicates the smoothed ROC areas at individual depths. It was obtained by computing a running average of ROC areas of 20 neurons moving one neuron at each step. E, Differential distributions of the state preference magnitudes between the dorsal vmPFC (top) and the ventral vmPFC (bottom) for the individual periods. The dorsal–ventral border was demarcated at the 3.3 mm transition point shown in D. Neurons that displayed significant preference for appetitive or aversive blocks are shown in red or blue, respectively. A blue asterisk indicates that the mean preference magnitude was significantly smaller than 0.5 (p < 0.05; sign test), meaning that the population preferred the aversive block. A red asterisk indicates that the mean preference magnitude was significantly larger than 0.5 (p < 0.05; sign test), meaning a preference for the appetitive block.

