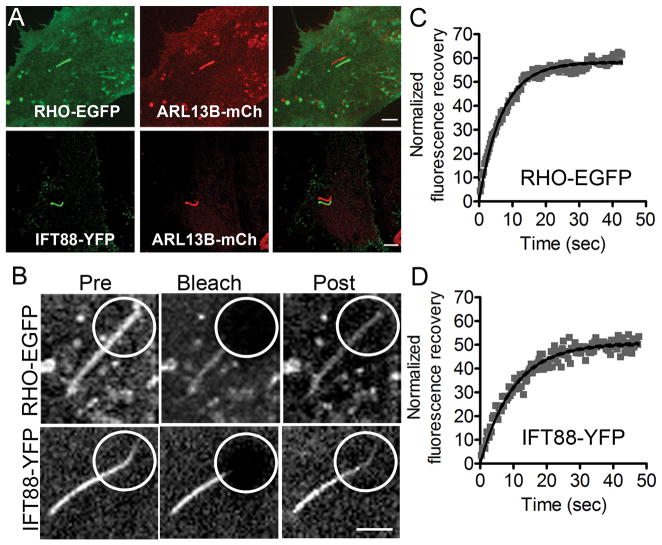
Fig 2.
FRAP of RHO and IFT88 in cilia of hTERT-RPE1 cells. (A) Cells cotransfected to express either RHO-EGFP with ARL13B-mCherry or IFT88-YFP with ARL13B-mCherry. ARL13B-mCherry was used as a live-cell cilium marker; right panels show shifted overlays. Scale bar = 5μm. (B) Images illustrating fluorescence recovery of RHO-EGFP and IFT88-YFP in the distal cilium. Pre, Pre-bleach; Post, recovery 3 minutes after photobleaching. Scale bar = 1 μm. (C, D) Examples of plots of normalized fluorescence recovery in the distal cilium vs time.

