Fig 3.
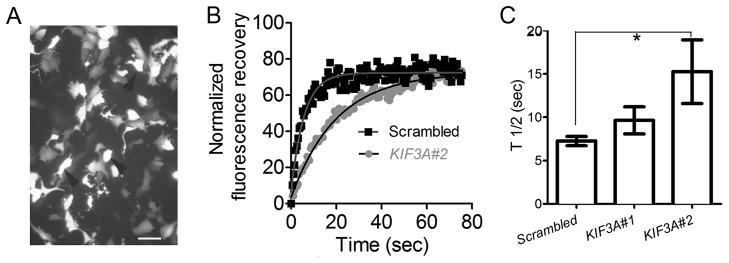
Reduction in FRAP of RHO-EGFP in the cilium of hTERT-RPE1 cells, following knock down of KIF3A. (A) Fluorescence image of hTERT-RPE1 cells, showing expression of RFP, 2 days after transfection with Kif3a shRNA. RFP was coexpressed with the shRNA, and used as a reporter to indicate which cells were likely expressing shRNA. Cells expressing high levels of RFP (e.g. arrowheads) were used for FRAP analysis. Scale bar = 10 μm. (B) Example of a plot of normalized fluorescence recovery vs time for RHO-EGFP in the distal cilium of cells expressing KIF3A#2 or scrambled shRNA. (C) Bar graph of the measured half-times, t1/2, for recovery of RHO-EGFP in the presence of WT or reduced levels of KIF3A (n=27 for scrambled; n=21 for KIF3A#1; n=27 for KIF3A#2; p<0.01 for scrambled vs KIF3A#2, indicated by asterisk).

