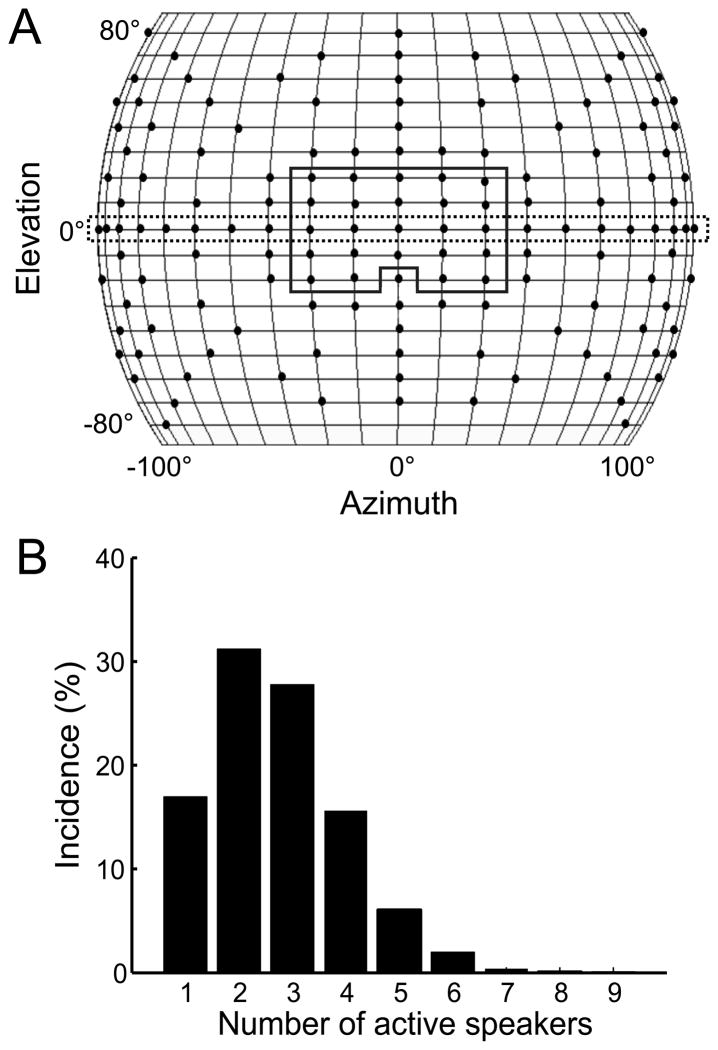
Figure 1.
Spatial white-noise stimulation. A) Schematic of the speaker array. The positions of the speakers are indicated by dots. Rectangular boxes show the subsets of speakers used for SWN stimulation. The solid and dashed lines indicate the square and linear arrays, respectively. B) Probability distribution of concurrent speaker activation during SWN. In a majority of instances, more than 1 speaker was simultaneously activated.

