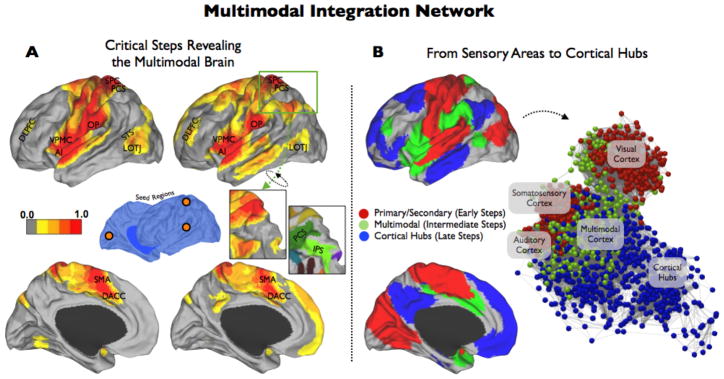
Figure 6. Multimodal Integration Network.
A SFC analysis combining the three sensory seeds simultaneously showed the complete map of the multimodal integration network of the human brain. Figure 6-A presents the three and five steps maps of the combined SFC analysis. Figure 6-B presents the initial (binarized average of the one step and two steps maps), intermediate (binarized average of the three to five steps maps) and terminal (binarized average of the six and seven steps maps) cores. It is noteworthy that the multimodal integration network (green cortex and nodes in B) acts as a strong network interface between the unimodal-related systems (red cortex and nodes in B) and the cortical hubs core (blue cortex and nodes in B). Sulcal map provided by Caret software (Van Essen and Dierker, 2007). Labels in cortical maps: LOTJ= Lateral Occipitotemporal Junction; VPMC= Ventral Premotor Cortex; AI= Anterior Insula; OP= Operculum Parietale; SPC= Superior Parietal Cortex; PCS= Posterior Central Sulcus; DLPFC= Dorsolateral Prefrontal Cortex; SMA= Supplementary Motor Area; DACC= Dorsal Anterior Cingulate Cortex; STS= Superior Temporal Sulcus, IPS= Intraparietal Sulcus.

