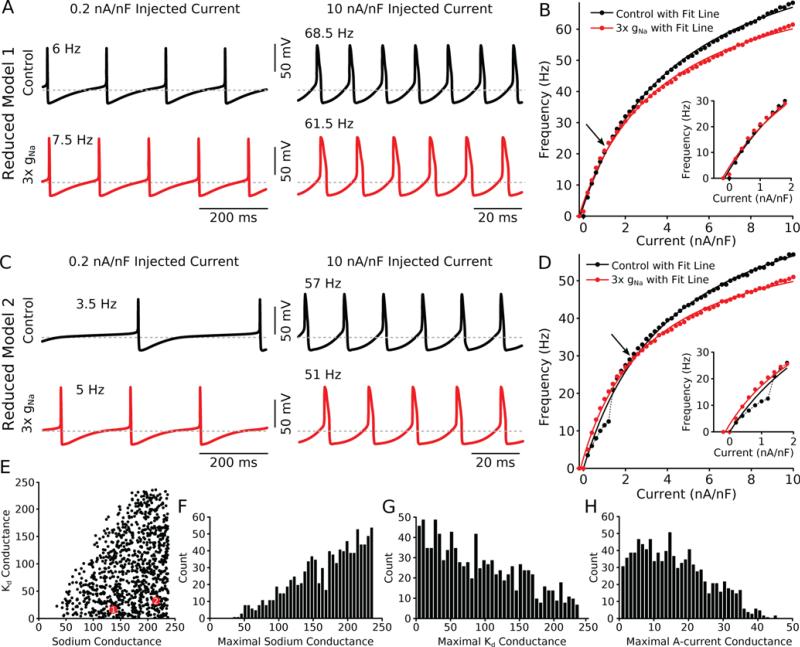
Figure 2. Reduced models show divisive gain change at high firing rates.
(A) Voltage traces from a single reduced model neuron at low injected current (0.2 nA/nF, left column) and high injected current (10 nA/nF, right column) demonstrate that tripling the sodium conductance increases the firing rate at low current injection levels (6 Hz to 7.5 Hz) but decreases the firing rate at higher current injection levels (68.5 Hz to 61.5 Hz). Red traces have tripled sodium conductance. (B) FI curve for this example model shows enhanced excitability at low rates (inset) and divisive gain change at higher rates. Lines indicate fits to the data points (control: r2 = 0.99, 3× gNa: r2 = 0.99). Arrow indicates crossover point. (C,D) Same as (A,B) for an additional example model (control: r2 = 0.98, 3× gNa: r2 = 0.99). Black dotted line in D (main panel and inset) connects individual control data points and highlights that there are models that experience rapid changes in frequency over the input current range. (E) Distribution of the sodium and Kd conductances for the entire, 1000 model database. Each black dot represents one model. Models drawn as larger red circles represent the models shown in (A,B, model 1) and (C,D, model 2). (F) Distribution of all the sodium conductances across the population. The selection criterion for this population favors higher values of maximal sodium conductance. (G) Distribution of all the maximal Kd conductances across the population. The selection criterion for this population favors lower values of maximal Kd conductance. (H) Distribution of all the maximal A-current conductances across the population.

