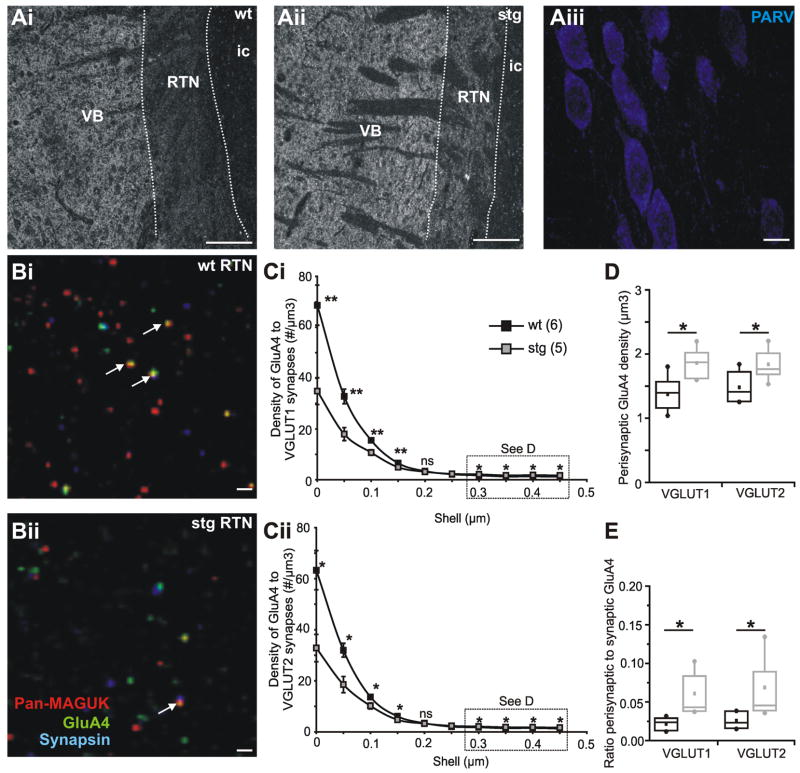
Figure 10. Array tomography reveals reductions in synaptic but increases in perisynaptic AMPA receptors in stg RTN.
Low magnification (10 X) array tomography image of VGLUT1 immunolabeling of one 100 nm section of a ribbon from wt (Ai) and stg (Aii) thalamus. In each case RTN can be clearly distinguished (white dotted lines) from the dorsal thalamus (VB; right) and internal capsule (ic; left) by the different intensities of VGLUT1 immunofluorescence. Scale bars = 200 μm. Extent of RTN was further verified at 63 X by parvalbumin (PARV) labeling, scale bar = 10 μm (Aiii). Array tomography image from stack of about 40 sections (100 nm) from wt (Bi) and stg (Bii) RTN immunostained for synaptic markers pan-MAGUK (pseudocolor red) and synapsin (psuedocolor blue), and AMPA receptor subunit GluA4 (pseudocolor green). Colocalization of the red and blue channels is displayed as magenta (“synapses”) and colocalization of all three proteins is displayed as white (white arrows depict some colocalized GluA4 containing “synapses”). VGLUT1 and VGLUT2 are not shown for clarity. Scale bars = 1 μm. C Radial analysis of GluA4 particle density in relation to VGLUT1 (Ci) and VGLUT2 (Cii) positive “synapses”, defined as those containing pan-MAGUK, synapsin and either VGLUT1 or VGLUT2 (filled squares: wt; empty squares: stg). D Average density of “perisynaptic” (0.3 to 0.5 μm) GluA4 particles associated with VGLUT1 or VGLUT2 synapses in wt (black) and stg (gray). E Ratio of perisynaptic to synaptic GluA4 puncta in wt (black) and stg (gray). *p < 0.05; **p < 0.005, ns = not significant.

