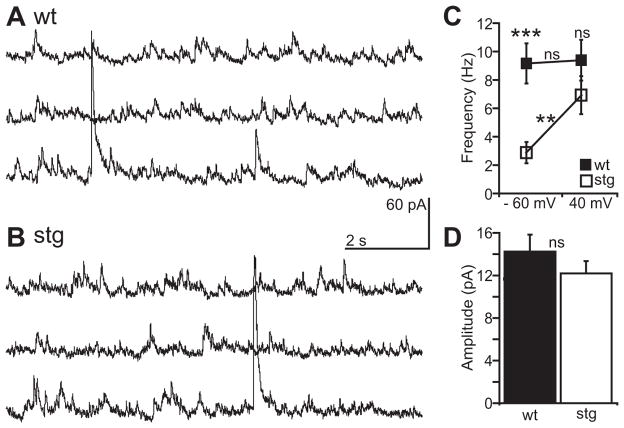
Figure 3. Pre-synaptic release of glutamate remains intact in stg RTN.
Representative continuous sEPSC recordings at positive holding potential (Vh = +40 mV) in wt (A) and stg (B) RTN cells. C Mean frequency of sEPSCs in stg (n = 14) and wt (n = 18) RTN cells is similar at positive holding potentials (p > 0.05). Further, sEPSC frequency is independent of membrane potential in wt cells (p > 0.05) but in stg cells it is significantly increased by depolarization (p < 0.001). D Population data showing mean amplitudes of sEPSCs at +40 mV are similar in wt and stg (p > 0.05). Significance assessed with Mann-Whitney test or Wilcoxon test **p < 0.005; ***p < 0.0005; ns = not significant.

