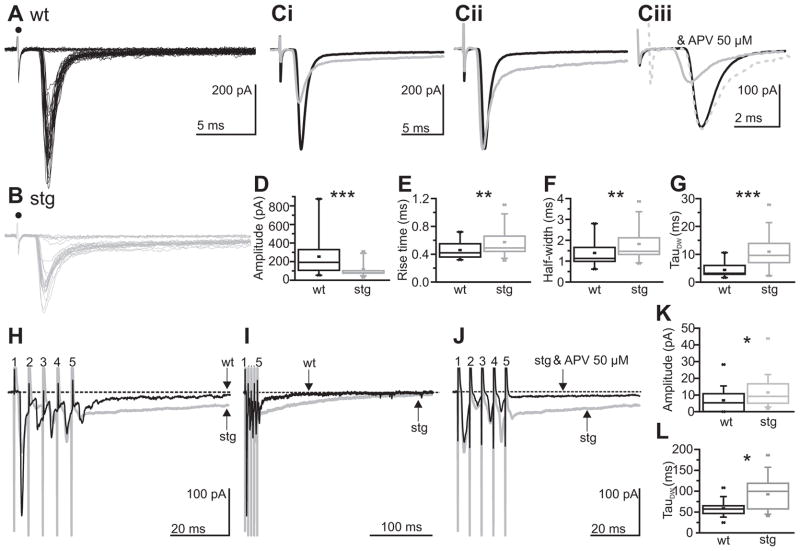
Figure 4. Slow evoked excitatory currents in stg RTN cells.
EPSCs evoked at threshold in the RTN by stimulating the internal capsule in wt (A) and stg (B). Filled circle denotes stimulus artifact. Average of successful responses from wt (in black) and stg (in gray) aligned to response onset (Ci) or aligned and normalized to peak (Cii). Ciii Averaged isolated AMPAR (in presence 50 μM APV and picrotoxin) responses from wt (in black) and stg (in gray) aligned to start of event (solid gray) or aligned and normalized to peak (gray dashed). D–G: Box-and-whisker plots to show mean amplitude (D), rise time (E), half-width (F), and weighted decay time constant (G) of EPSCs (no 50 μM APV). Amplitude and kinetics of the evoked events are respectively smaller and slower in stg cells. H – J: Mean responses to trains of stimuli (10 trains of 5 pulses at 200 Hz) applied to internal capsule at 1.5 times threshold and the subsequent mean responses in representative wt (black) and stg (gray) RTN cells. The stimulation number and artifacts are highlighted by numbers. The dashed line illustrates baseline current. Although the initial direct EPSC responses are smaller in stg cells, the residual current 50 ms subsequent to the train is larger (see arrows; H and K) and slower to decay to baseline (arrows show time at which the current reaches baseline for each cell; I and L) in stg cells than wt cells. The residual current is NMDA receptor dependent as it was blocked by application of an NMDA receptor antagonist APV (J; stg control condition in gray and after application of APV in black). *p < 0.05; **p < 0.005; ***p < 0.0005.

