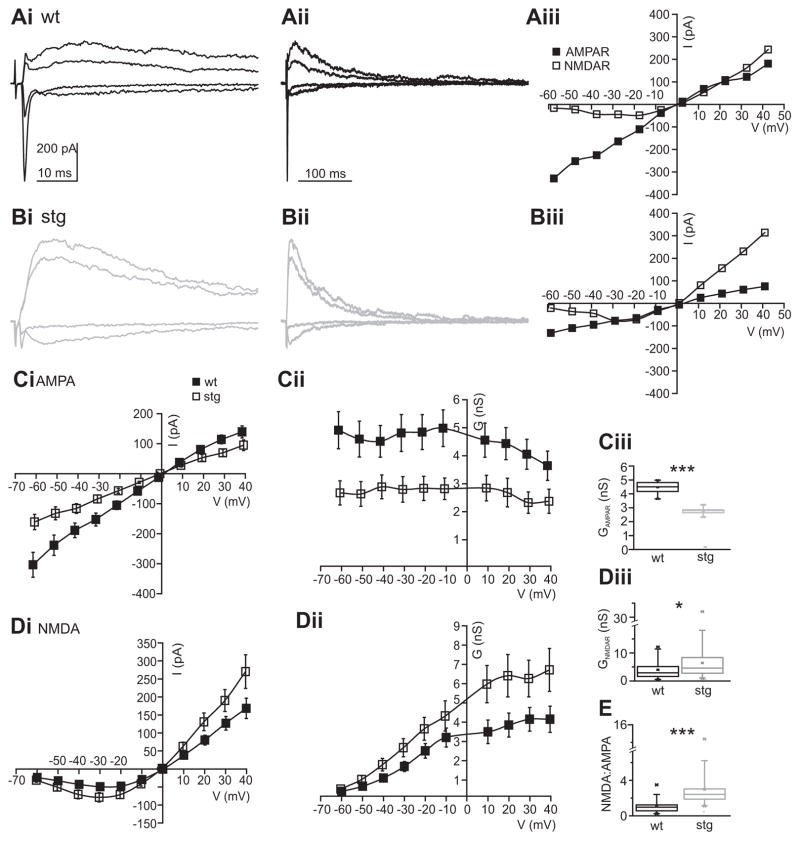
Figure 5. Decreased AMPA conductance but increased NMDA conductance in stg RTN evoked EPSCs.
Representative examples of evoked EPSCs from several holding potentials (−60, −30, 30 and 40 mV) at different time scales in wt (Ai and Aii) and stg (Bi and Bii) RTN cells with the respective I/V curves for AMPAR (filled squares) and NMDAR (empty squares) components on the right (Aiii and Biii). AMPAR currents (Ci) and conductance (Cii) are reduced in stg cells (empty squares) compared to wt (filled squares). Cii Box-and-whisker plot of mean AMPAR conductance. NMDAR currents (Di) and conductance (Dii) are increased in stg cells (empty squares) compared to wt (filled squares). Diii Box-and-whisker plot of maximum NMDAR conductance (mean conductance at 20 to 40 mV) in wt and stg RTN cells. E Box-and-whisker plot showing that the NMDAR to AMPAR ratio at 20 to 40 mV is increased in stg cells. *p < 0.05; **p < 0.005; ***p < 0.0005

