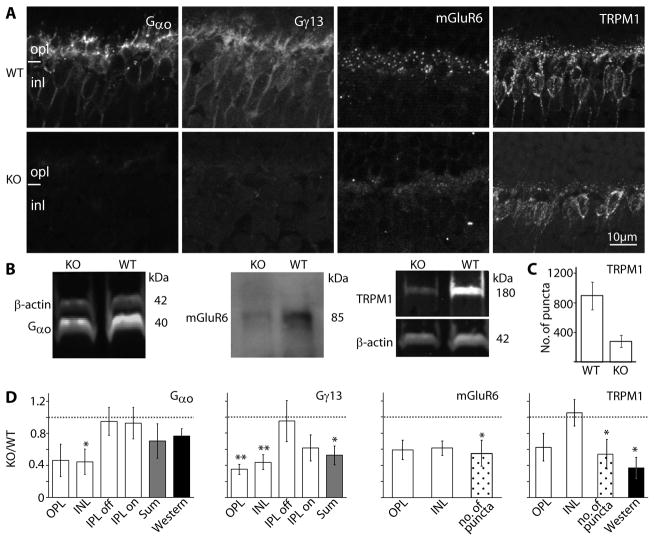
Fig. 6. The essential cascade elements are down regulated.
A. Immunostaining of wild type (WT, top) and Gnb3-null (KO, bottom) retinas for Gαo, Gγ13, mGluR6, and TRPM1. Staining in the null mouse was greatly reduced. B. Western blots for Gαo and TRPM1 were done with the Odyssey reagents (bands are brighter than background) and for mGluR6 were performed with the ECL technique (bands are darker than background). Bands’ identities and molecular weights are indicated on the sides of the blots. All three proteins are downregulated in the null mouse. C. Bar chart showing the average number of TRPM1 positive puncta in the outer plexiform layer (within a retinal area of 1680 μm2) in the WT and null retina (n=3 for each). D. Relative immunostaining intensity (i.e., staining intensity in null divided by staining intensity in wild type) for various proteins in the layers of the retina (white bars), sum intensity of all layers (gray bars), and relative intensity of the protein bands (Western, dark bars). For staining patterns that show puncta in the OPL, the relative number of puncta is also shown (dotted bars). * indicates p<0.05 and ** indicates p<0.01. Western blot quantification for mGluR6 was not performed because of the need to use ECL; however, in every set, the mGluR6 band in the null retina is less intense than that in wild type. The dotted horizontal line shows unity, i.e., when wild type and null retinas are the same. All experiments were performed on at least 3 sets, where a set included a null and wild type retina from litter mates; when a litter mate was not available, an age matched wild type was used. For this and following figures, same settings are used for each pair of pictures.

