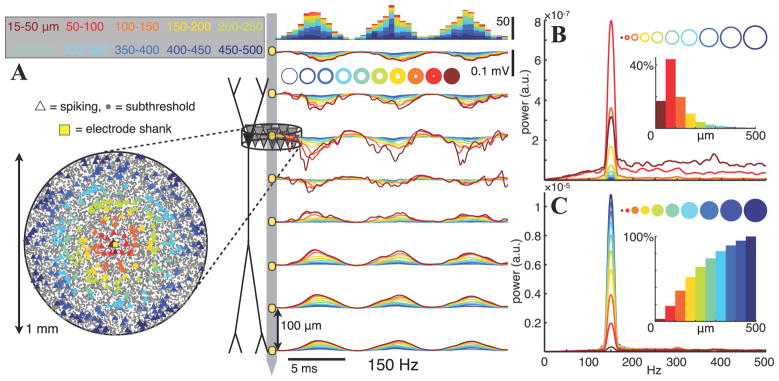
Figure 4.
A, Extracellular potentials (right) along the stratum oriens – stratum radiatum axis in a rhythmically bursting population with ~6% of the population firing each 10 ms. Spike bursts recur periodically at 150 Hz and have a Gaussian shape with σ = 1.3 ms (i.e., 1/5th of the oscillation period). The locations of neurons that spike during one 6.7 ms period are indicated by triangles in a top-down view of the pyramidal layer (left), with colors indicating the 50 μm wide ring from which the spikes originate. Ve traces are colored correspondingly, with contributions from each ring of cells adding cumulatively from the outside in. Stacked histograms above the potential traces show spike times. B, C, Averaged power spectra of the stratum pyramidale Ve from each individual ring (B) and for the inside-out cumulative potentials indicated by the colored disks (C). Insets indicate the proportions of the total Ve 150 Hz power generated by each ring- or disk-shaped subpopulation (i.e., the peak values of the power spectra, normalized by the power at 150 Hz in the full population). Note that the contributions of the rings in B to the cumulative spectra in C do not sum linearly because we are displaying spectral power, which is proportional to the square of the amplitude.

