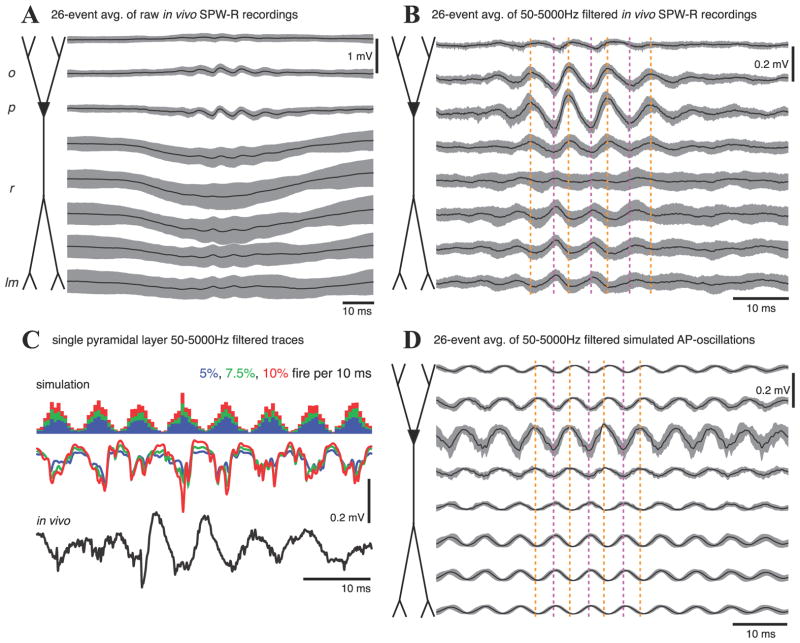
Figure 6.
A, Ripple-triggered average of wideband in vivo depth recordings (100 μm electrode spacing) during 26 SPW-Rs with a dominant frequency between 140–160 Hz. Note the large variability in the SPW field potentials in the apical dendritic region, consistent with the ripple oscillation being generated locally, rather than driven by a coherent CA3 oscillation (Csicsvari et al., 2000). B, 50–5000 Hz bandpass filter applied before averaging the ripple events in A. The ripple is strongest in the pyramidal layer (Ylinen et al., 1995), with a phase reversal 150–200 μm below (in stratum radiatum). Dashed vertical lines are visual aids for phase alignment. C, Comparison of single representative stratum pyramidale voltage traces for simulated ripples consisting only of EAPs from a pyramidal cell population in which 5% (blue), 7.5% (green), or 10% (red) of the cells fire each 10 ms (spike histograms shown above voltage traces) and filtered in vivo ripple events (black). The firing probabilities are modulated by the same probability function as in Figs. 2 and 4. D, 26-trial average of simulated EAP-generated ripples with frequencies set to the dominant frequencies measured during the in vivo ripple events of A and B.

