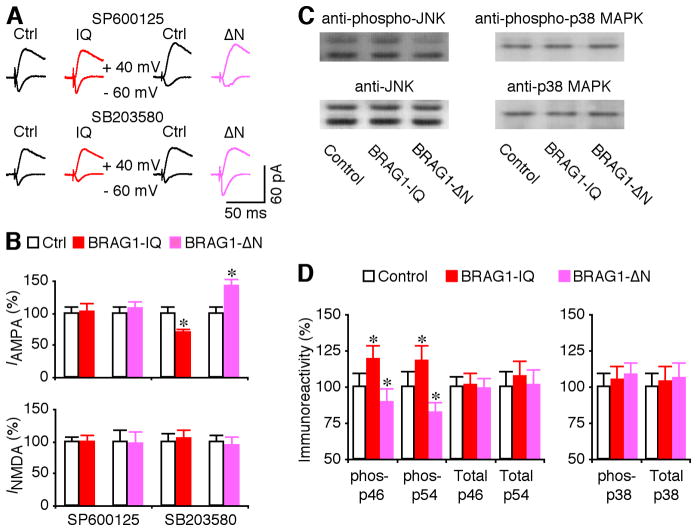
Figure 9. BRAG1 signals synaptic depression via JNK.
(A) Evoked AMPA-R- (−60 mV) and NMDA-R- (+40 mV) mediated responses recorded from neighboring non-expressing (Ctrl) and mCherry-tagged BRAG1-IQ or BRAG1-ΔN expressing neurons cultured in media containing 5 μM SP600125 or 2 μM SB203580. (B) Values for AMPA responses in neurons expressing BRAG1-IQ and BRAG1-ΔN cultured in media containing SP600125 (Ctrl: −23.0±2.1 pA; IQ: −23.5±2.8 pA; n=26, p=0.81; Ctrl: −18.4±1.6 pA; ΔN: −19.7±2.0 pA; n=23, p=0.48), or SB203580 (Ctrl: −26.0±2.2 pA; IQ: −18.2±1.4 pA; n=28, p<0.005; Ctrl: −17.9±1.6 pA; ΔN: −25.5±1.9 pA; n=23, p<0.01), and for NMDA responses in neurons expressing BRAG1-IQ and BRAG1-ΔN cultured in media containing SP600125 (Ctrl: 55.4±4.7 pA; IQ: 55.4±6.0 pA; n=26, p=0.53; Ctrl: 60.7±10.6 pA; ΔN: 58.3±12.1 pA; n=23, p=0.38), or SB203580 (Ctrl: 51.3±6.7 pA; IQ: 54.0±6.2 pA; n=28, p=0.93; Ctrl: 60.6±6.3 pA; IQ: 56.4±7.7 pA; n=23, p=0.43) related to control nonexpressing neurons. (C) Western blots of phospho-p46/54 JNK or p38 MAPK in control hippocampal CA1 regions, hippocampal CA1 regions expressing BRAG1-IQ and hippocampal CA1 regions expressing BRAG1-ΔN. Each lane was loaded with the same amount of protein (45 μg). (D) Left, relative amounts of phospho-p46 (ctrl: 100.0±5.3%; IQ: 118.9±7.5%; n=12; p<0.005; ΔN: 89.6±5.8%; n=12; p<0.01) and phospho-p54 (ctrl: 100.0±11.0%; IQ: 117.4±11.6%; n=12; p<0.005; ΔN: 81.6±9.9%; n=12; p<0.005) JNK in hippocampal CA1 regions expressing BRAG1-IQ and BRAG1-ΔN. Relative amounts of total p46 (ctrl: 100.0±7.7%; IQ: 101.2±8.2%; n=12; p=0.64; ΔN: 98.3±8.1%; n=12; p=0.43) and total p54 (ctrl: 100.0±10.2%; IQ: 107.2±11.0%; n=12; p=0.14; ΔN: 101.3±10.2%; n=12; p=0.24) JNK in hippocampal CA1 regions expressing BRAG1-IQ and BRAG1-ΔN. Right, relative amounts of phospho-p38 MAPK (ctrl: 100.0±9.1%; IQ: 105.1±9.5%; n=12; p=0.31; ΔN: 107.9±8.7%; n=12; p=0.11) in hippocampal CA1 regions expressing BRAG1-IQ and BRAG1-ΔN. Relative amounts of total p38 MAPK (ctrl: 100.0±9.9%; IQ: 103.0±10.8%; n=12; p=0.64; ΔN: 106.0±10.7%; n=12; p=0.94) in hippocampal CA1 regions expressing BRAG1-IQ and BRAG1-ΔN. The relative values and standard errors were normalized to average amounts of AMPA and NMDA responses from control CA1 cells, phospho-JNK, phospho-p38 MAPK, total JNK or total p38 MAPK from control hippocampal CA1 regions. Asterisk indicates p<0.05 (Wilcoxon test).

