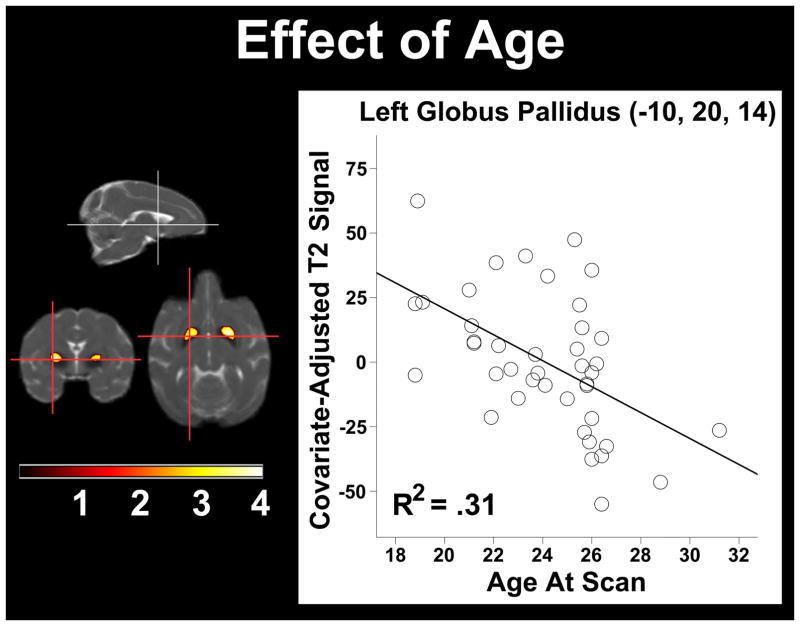
Figure 1.
The correlation of Age at scan and T2 signal. Statistical parametric map of significant decreases in T2 signal were found within bilateral globus pallidus. The maximum voxel in the left hemisphere is plotted and depicts the main effect. As Age increases, the T2 signal decreases and represents increased iron concentration. The voxel and cluster thresholds were respectively p < .005 (uncorrected) and p < .05 (corrected).

