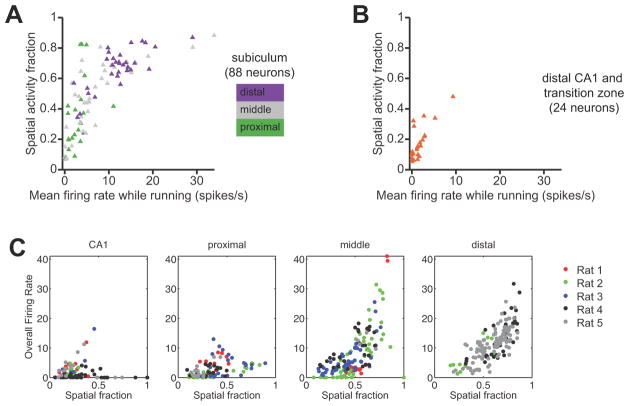
Figure 3.
A, Summary of mean firing rate and spatial activity fraction for all putative principal neurons recorded in the subiculum. Only valid running passes during task sessions were included in the calculation of mean firing rate. Each symbol corresponds to a single neuron. Symbols are color-coded by anatomical location along the transverse axis of the subiculum. Spatial representation within the subiculum exhibits a proximal-distal gradient. B, Summary of mean firing rate and spatial activity fraction for all putative principal neurons recorded in distal area CA1 and in the CA1/subiculum transition zone. Comparison of panels A and B reveals that neurons in area CA1 have lower mean firing rates and finer spatial selectivity than neurons in the subiculum. C, Firing rate versus spatial activity pattern for each unit in each recording session, across rats and brain regions.

