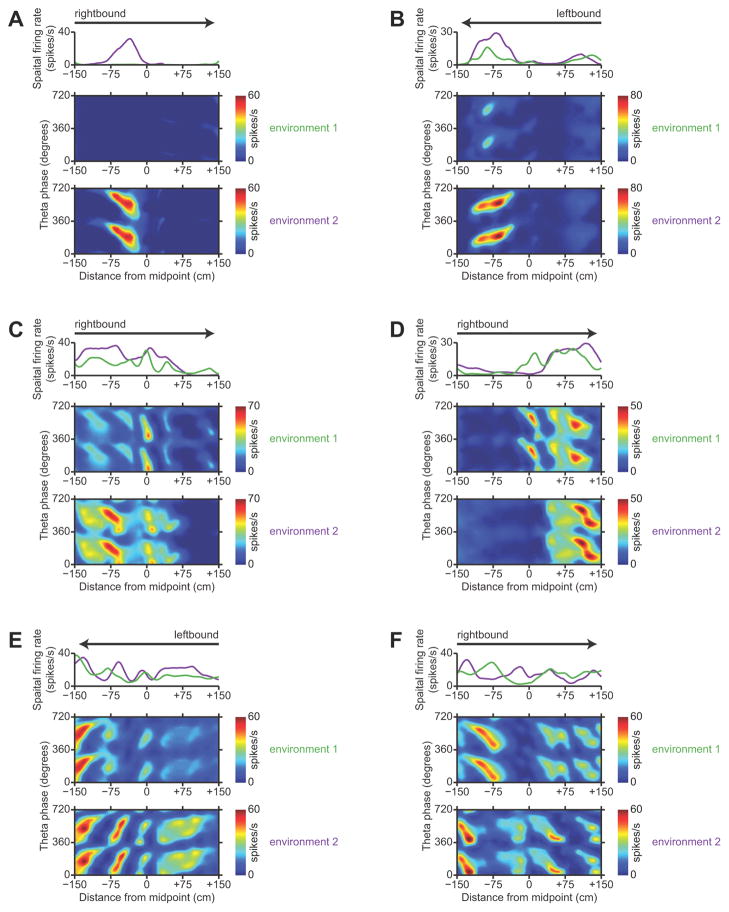
Figure 5.
Examples of remapping in the subiculum. A–F, Each panel shows position-phase firing-rate maps of a single neuron in the same direction of travel in both environment 1 and environment 2, along with a comparative overlay of the spatial firing-rate profiles in the two environments. Arrows indicate the direction of travel. To show firing-rate differences, the firing-rate maps in each pair are plotted with the same color scale. Dark blue is zero, and dark red is the maximum firing rate encountered in either environment. A, B Representative neurons in the proximal subiculum. C, D Representative neurons in the middle subiculum. E, F Representative neurons in the distal subiculum.

