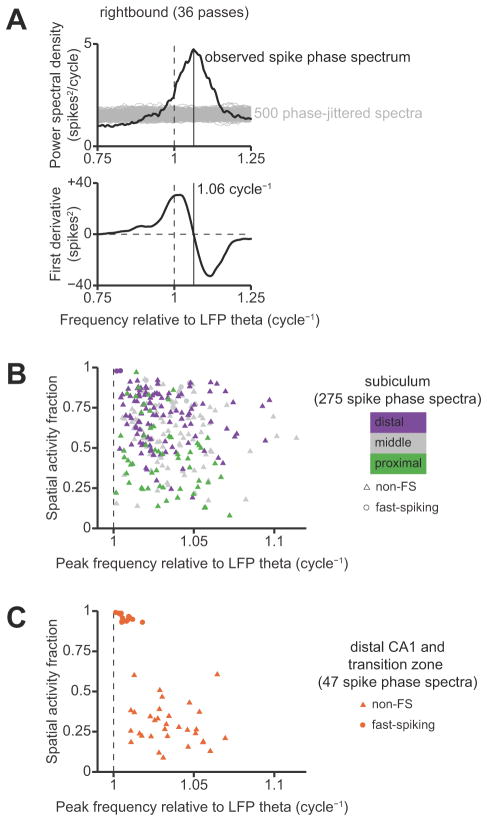
Figure 9.
Spectral analysis of theta phase precession. A, The spike phase spectrum of a representative neuron in the subiculum. This example corresponds to the same neuron, environment, and direction of travel that is shown in Figure 7A. The top panel shows the estimated power spectral density, while the bottom panel shows the estimated first derivative of the spectrum with respect to frequency. Note that this first derivative was estimated using the covariance of the multitaper eigenspectra, not by numerical differentiation of the estimated power spectral density. The solid vertical line indicates the peak frequency, which is greater from unity, indicating phase precession. Gray lines in the top panel are spike phase spectra computed for 500 surrogate spike trains in which spikes were independently jittered within a single theta cycle. This shuffle test shows that the peak in the observed spike phase spectrum is statistically significant. B, Summary of peak frequencies for all spike phase spectra of subicular neurons that have significant peaks. Each symbol corresponds to spike phase spectrum of a single neuron in a particular environment and direction of travel. Spatial activity fractions were computed from the corresponding firing-rate maps. The spike phase spectra of fast-spiking neurons (putative inhibitory interneurons) are plotted as circles, and the spike phase spectra of non-fast spiking neurons (putative pyramidal neurons) are plotted as triangles. Symbols are color-coded according to the anatomical location of the neuron along the transverse axis of the subiculum. The peaks of the spike phase spectra for putative principal neurons occur at frequencies that are shifted above unity, and the distribution of peak frequencies is similar across proximal-distal locations within the subiculum. C, Summary of peak frequencies for all spike phase spectra of CA1 neurons that have significant peaks.

