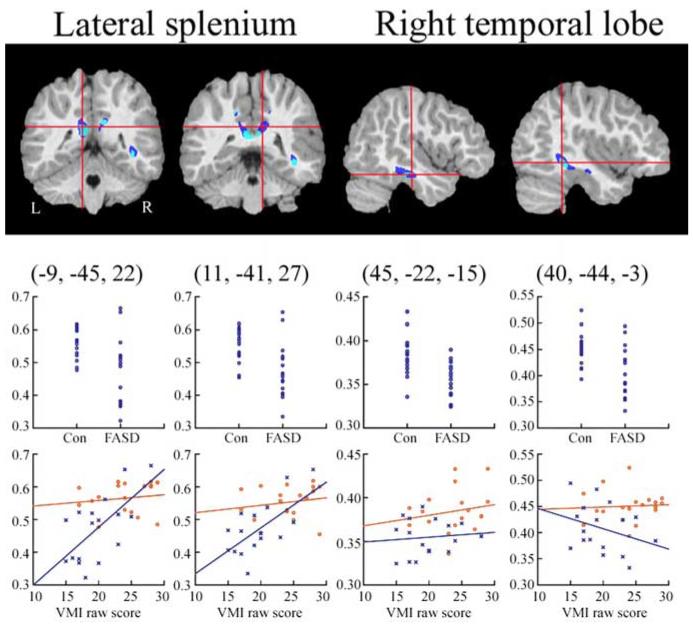
Figure 2.
ROI FA analyses and brain behavior correlations. Coronal and sagittal slices of one representative subject’s brain with significant clusters from the FA and WMD analyses. Color coding for significant clusters is the same as described for Figure 1. The y-axes for all graphs have FA values. In the top row of graphs, FA values for each subject are shown for the FASD and control groups. FA values were taken from ROIs (localized approximately at the intersection of the crosshairs in each image) of all voxels within an 8 mm sphere in the unsmoothed, white matter masked FA volume for each individual. In the bottom row, FA values from the same ROIs are shown in relation to subjects behavioral scores on the VMI. Control subjects are shown in red and FASD subjects in blue. Correlations between VMI scores and FA were highly significant in the left and right lateral splenium ROIs within the FASD, but not control subjects, and not for either group in the anterior and posterior temporal ROIs.

