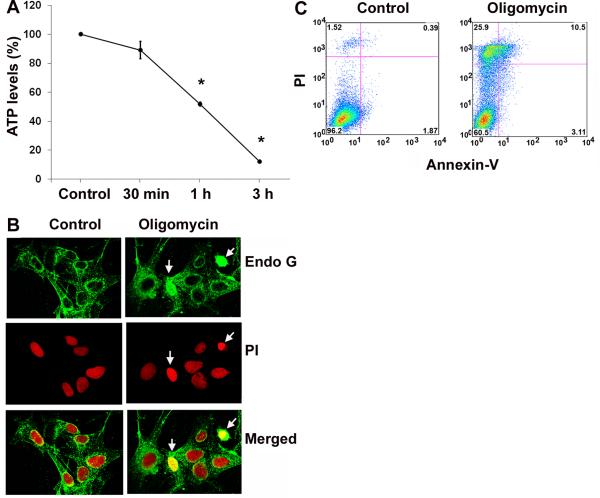
Figure 10.
(A) ATP depletion induced by oligomycin treatment in HEI-OC1 cells. The concentration of ATP was measured over time in HEI-OC1 cells treated with 1 μM oligomycin using the ATP Bioluminescence Assay Kit HS II as described in the ‘Materials and Methods’ section. Data are presented as means ± SD; n = 3; *p < 0.05 after 1 and 3 h of treatment. (B) Endo G staining in the nuclei of some cells 1 h after 1 μM oligomycin treatment (arrows). Endo G is stained green, and nuclei red with propidium iodide (PI). (C) Oligomycin induces cell death. Following incubation with 1 μM oligomycin for 24 h, cell death of HEI-OC1 cells was detected by a flow cytometry assay. Oligomycin treatment significantly increased the amount of cell death compared to the control treatment (p < 0.05; n = 5).

