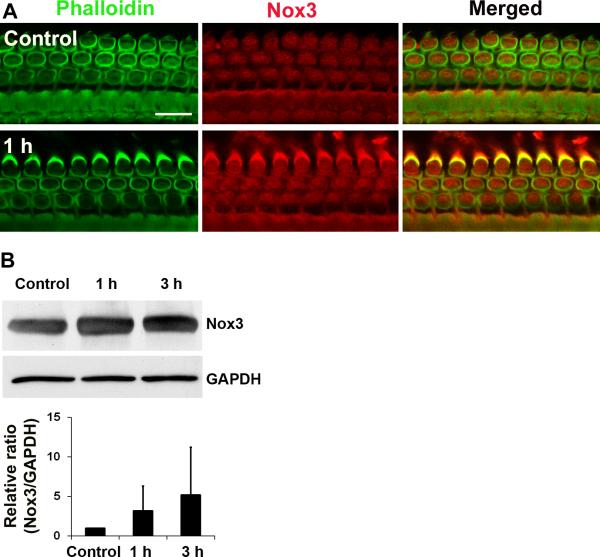
Figure 8.
(A) Expression of Nox3 increased in sensory hair cells after traumatic noise exposure. Representative images from surface preparations showed an increase in fluorescence (red) of Nox3 antibody in hair cells 1 h post-noise exposure. These images were taken from the upper basal turn and each figure is representative of 4 individual mice for each condition. Scale bars = 10 μm. Quantification of Nox3-associated fluorescence in outer hair cells showed a significant increase (p < 0.05; n = 4). (B) Western blotting of Nox3 in total cochlear extracts showed a single band for Nox3 with no significant difference between control, 1 h, and 3 h post-BBN exposure at 106 dB for 2 h. Data are presented as means + SD, n = 7.

