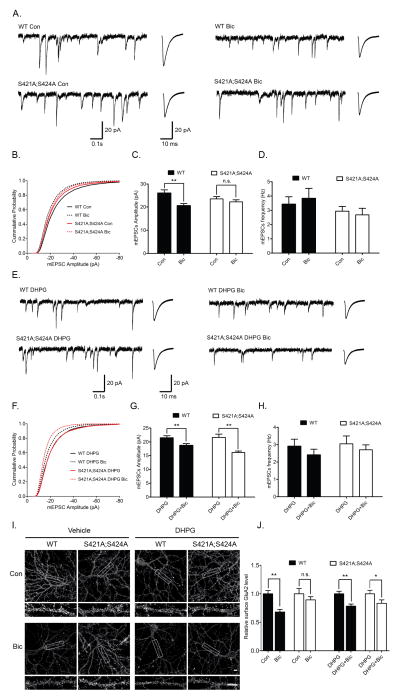
Figure 3. Pre-treatment with group I mGluR agonist restores bicuculline-induced synaptic scaling down in Mecp2S421A;S424A/y hippocampal neurons.
A–D) Representative whole-cell recording sample traces, average mEPSC waveforms, cumulative probability distribution and quantification of mEPSC amplitudes and frequencies from cultured Mecp2S421A;S424A/y and wild type hippocampal neurons (18–20 DIV) treated for 48h with either control solution or bicuculline (40 μM) (n=22–32 cells in each group). These data were not included in Figure 1. E–H) Representative whole-cell recording sample traces, average mEPSC waveforms, cumulative probability distribution and quantification of mEPSC amplitudes and frequencies from cultured Mecp2S421A;S424A/y and wild type hippocampal neurons (18–20 DIV) pretreated with 30 min DHPG (100 μM), followed by 48h treatment of either control solution or bicuculline (40 μM) (n=22–32 cells in each group). I and J) Representative images and quantification of surface GluA2 immunoreactivity in cultured Mecp2S421A;S424A/y and wild type hippocampal neurons (18 DIV) with or without 30 min DHPG (100 μM) pretreatment, followed by 48h treatment of either control solution or bicuculline (40 μM). Scale bar: 10 μm. (n=20 cells each group). The bar graph shows the mean ± s.e.m * p<0.05. ** p<0.01

