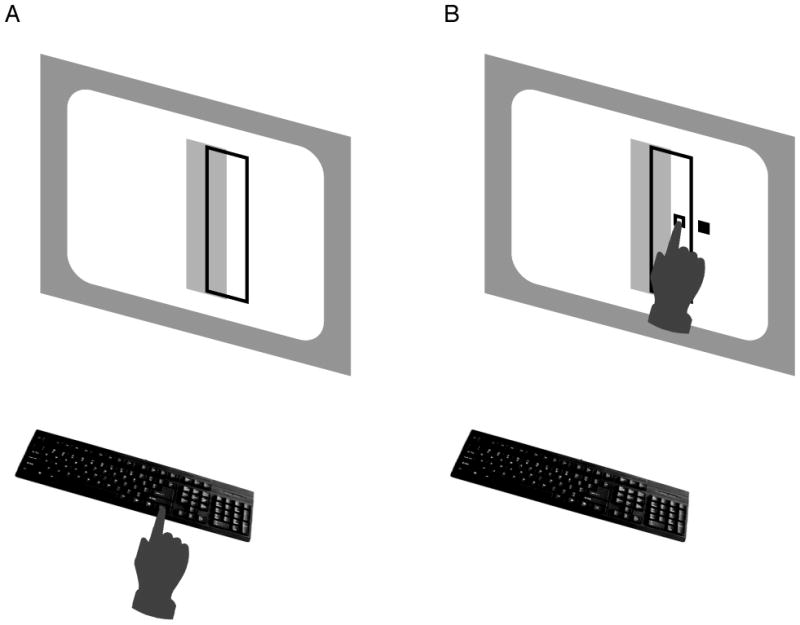
Figure 1.

Stimuli and task. A, The initial stimulus display consisted of a green outlined target region and an overlapping red penalty region (here shown as outlined black and solid gray, respectively). Participants performed a speeded reach with the right hand, attempting to hit the target while avoiding the penalty region. B, After the movement was complete, a small white square indicated the reach endpoint. A small blue square was also displayed, randomly displaced horizontally away from the reach endpoint (here shown as open and filled squares, respectively). The participant received 1 point (4¢) for each endpoint within the target region and lost 5 points for hitting the penalty region. Slow movements (> 400 ms) led to a 10-point penalty.
