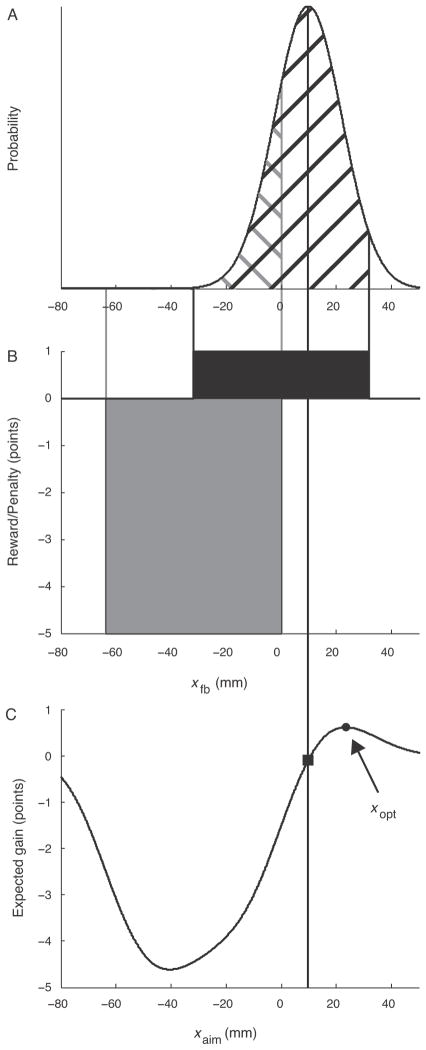
Figure 2.
Expected gain and optimal strategy. A, Illustration of the distribution of perturbed reach endpoints xfb for reaches with aimpoint xaim (indicated by the black vertical line). B, Experimenter-imposed rewards (black) and penalties (gray). The probability of hitting the target or penalty is indicated by the black and gray cross-hatching in A. C, Expected gain as a function of aimpoint. The black square indicates the expected gain for the example in A. The black circle corresponds to the optimal aimpoint xopt resulting in maximum expected gain.

