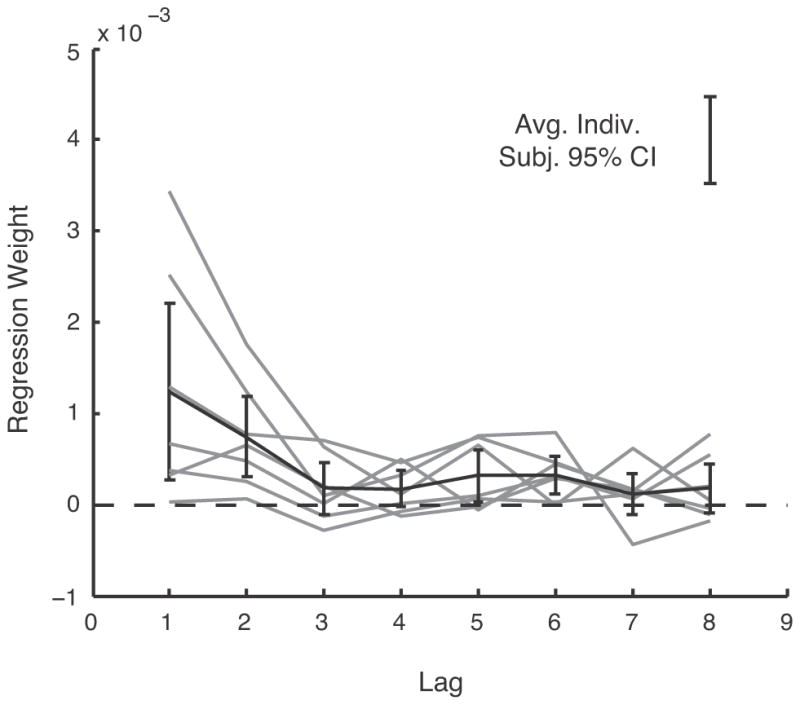
Figure 7.

Lagged regression. Results of a regression predicting each trial’s reach endpoint as a linear combination of the previous 8 trials’ squared perturbations. Gray: individual subjects. Black: Group average and ±2 SE error bars. The isolated error bar at the upper right represents the average, over subjects and lags, of the 95% CI from the individual linear regressions.
