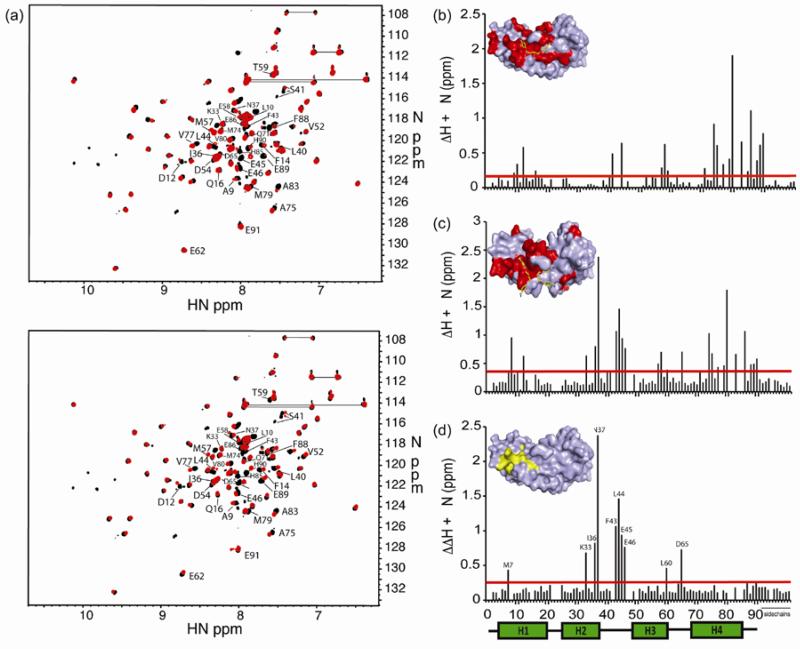
Figure 2.
HSQC perturbations upon addition of compound to S100B. (a) HSQC spectrum of S100B with heptamidine (top, red) or pentamidine (bottom, red) overlaid onto S100B control (black). Residues that experience significant perturbation are labeled. (b) and (c) Graphical representation of the perturbation of chemical shifts experienced by S100B upon addition of heptamidine (b) or pentamidine (c). The red bar denotes twice the average perturbation; values greater than this line are considered significant. The insets depict a surface representation of S100B bound to heptamidine (b) or pentamidine (c); residues which are significantly perturbed or disappear completely upon addition of compound are colored red, and atoms of the compound are colored yellow (carbon), blue (nitrogen) and red (oxygen). (d) Difference between perturbations of S100B caused by pentamidine and heptamidine. The inset depicts residue perturbations that are not shared by the two compounds in yellow.

