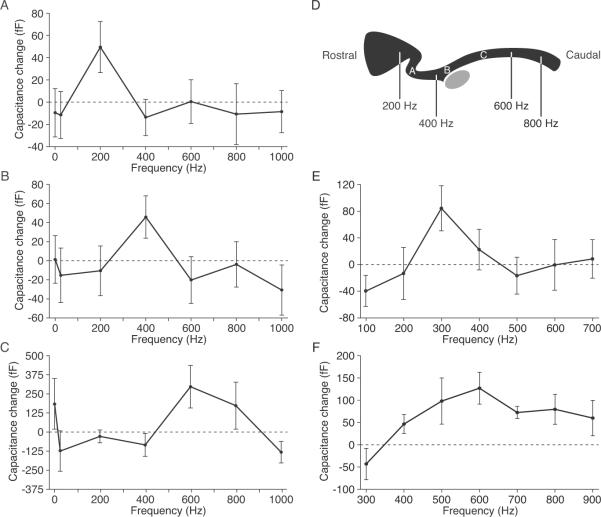
Figure 2.
Frequency selectivity of exocytosis. (A) Synaptic release from a rostrally positioned hair cell peaked for stimulation at 200 Hz. (B) A hair cell from the middle portion of the amphibian papilla was most responsive at 400 Hz. (C) A cell located farther the caudal end of the papilla responded best near 600 Hz. In these three and 13 other cells, the capacitance change at the best frequency significantly exceeded that at the flanking frequencies (P < 0.05). (D) A schematic diagram of the bullfrog's amphibian papilla shows the locations of the three hair cells whose responses are depicted in panels A–C. The approximate positions of afferent fibers with various characteristic frequencies are indicated (Lewis et al., 1982). The gray ellipse represents the organ's cross-sectioned nerve. (E) When held at an elevated potential of −45 mV and stimulated at a more closely spaced set of frequencies, a hair cell from the rostral region of the papilla showed a preferential response to stimulation at 300 Hz. (F) A hair cell from the middle portion of the papilla also displayed tuning when stimulated over a narrower range of frequencies.

