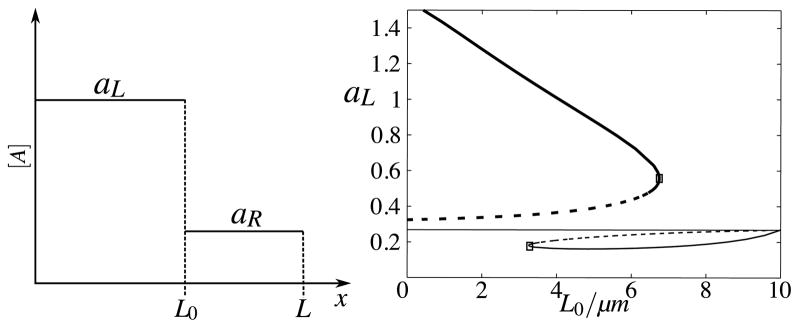
Fig. 12. Polarised cell state analysis.
Schematic of the simplified deterministic wave-shaped state, consisting of a high plateau aL of length L0 on the left, and a low plateau aR of length L − L0 on the right. (Right) Bifurcation plot of steady-state concentrations of aL as a function of L0, with parameters as in Fig. 6 and with total amount T = 22.68. Two saddle-node bifurcations occur at critical values and . The corresponding bifurcation plot of aR is symmetric to this one of aL. In our stochastic simulations, for equivalent parameter values and number of molecules = 6,820, we did not observe pinning positions greater than 6 μm (top inset, Fig. 6), as is predicted by this analysis

