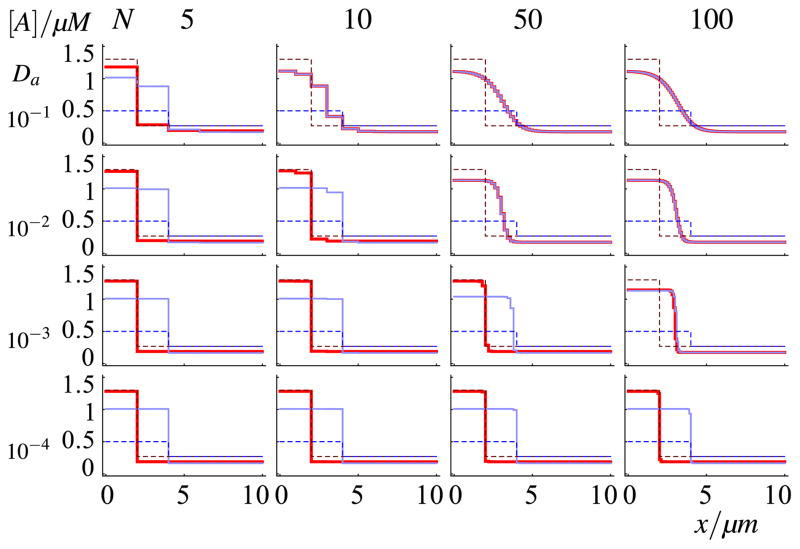
Fig. 5. Propagation failure in the deterministic system as a function of grid coarseness and diffusion coefficient of the active form.
For each column a different number of compartments, N, has been used, and for each row a different diffusion coefficient, Da. The values of both are indicated in the figure, with diffusion coefficient Da in units μm2/s. Dashed lines denote initial conditions, solid lines are equilibrium profiles (at t = 20,000 s), thick red lines denote narrow, high initial waves, thin blue lines denote broad, shallow initial waves. Discrepancies between the red and blue equilibrium profiles for slow diffusion coefficients and coarse grids can be attributed to propagation failure. At our default setting of Da = 0.1 μm2/s and N = 50, propagation failure is not observed (Color figure online)

