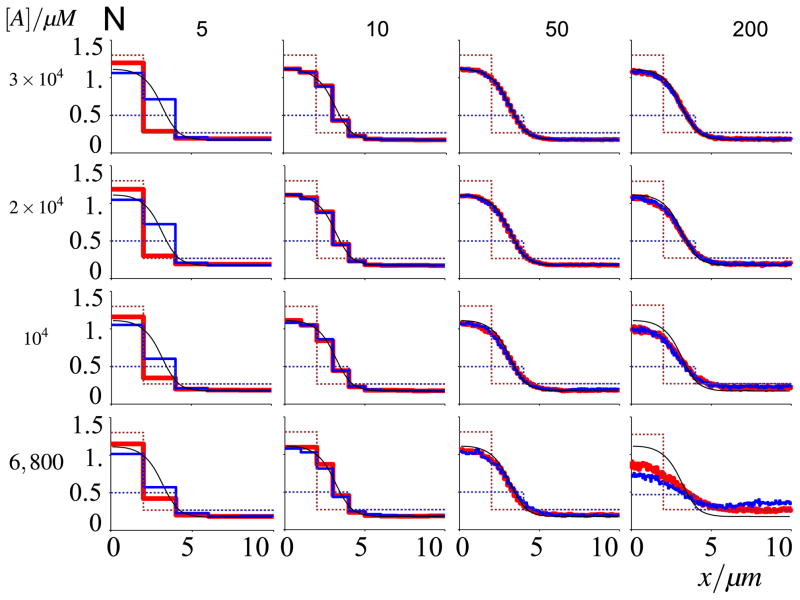
Fig. 8. Propagation failure within stochastic simulations as a function of grid coarseness and molecule number.
Dashed profiles indicate initial conditions, correspondingly coloured solid lines depict mean equilibrium profiles at t = 200 s, averaged over 100 runs. Confidence intervals are omitted for reasons of clarity, but standard errors of mean are similar to Fig. 6. Da = 0.1 μm2/s; the number of compartments and molecules are indicated in the figure. Propagation failure does not affect 50 lattice point simulations. At small molecule numbers, however, larger numbers of lattice points present deviations that are unlike propagation failure (Color figure online)

