Figure 2.
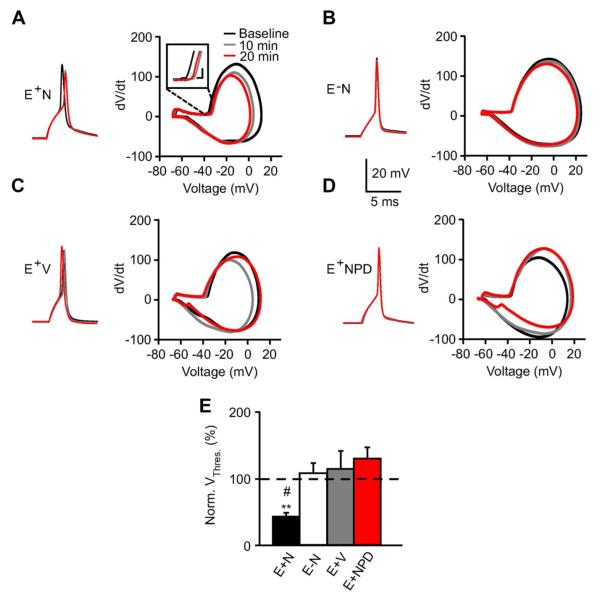
NRG1 depolarizes action potential threshold. A–D, Representative traces of a single AP evoked from a suprathreshold current injection (left) and corresponding phase plots (dV/dt vs Vm; right) measured at baseline (black), and following 10 min (gray) and 20 min (red) of treatment. Inset magnifies threshold in E+N phase plot. Calibration: 2 mV, 10 mV/s. E, Summary graph for normalized AP threshold, as determined by d3V/dt3 plots, at 20 min (E+N, n = 5; E−N, n = 5; E+V, n = 5; E+NPD, n = 6). **p < 0.005 comparing E+N to E+NPD; #p < 0.05 comparing E+N to E−N and E+V.

