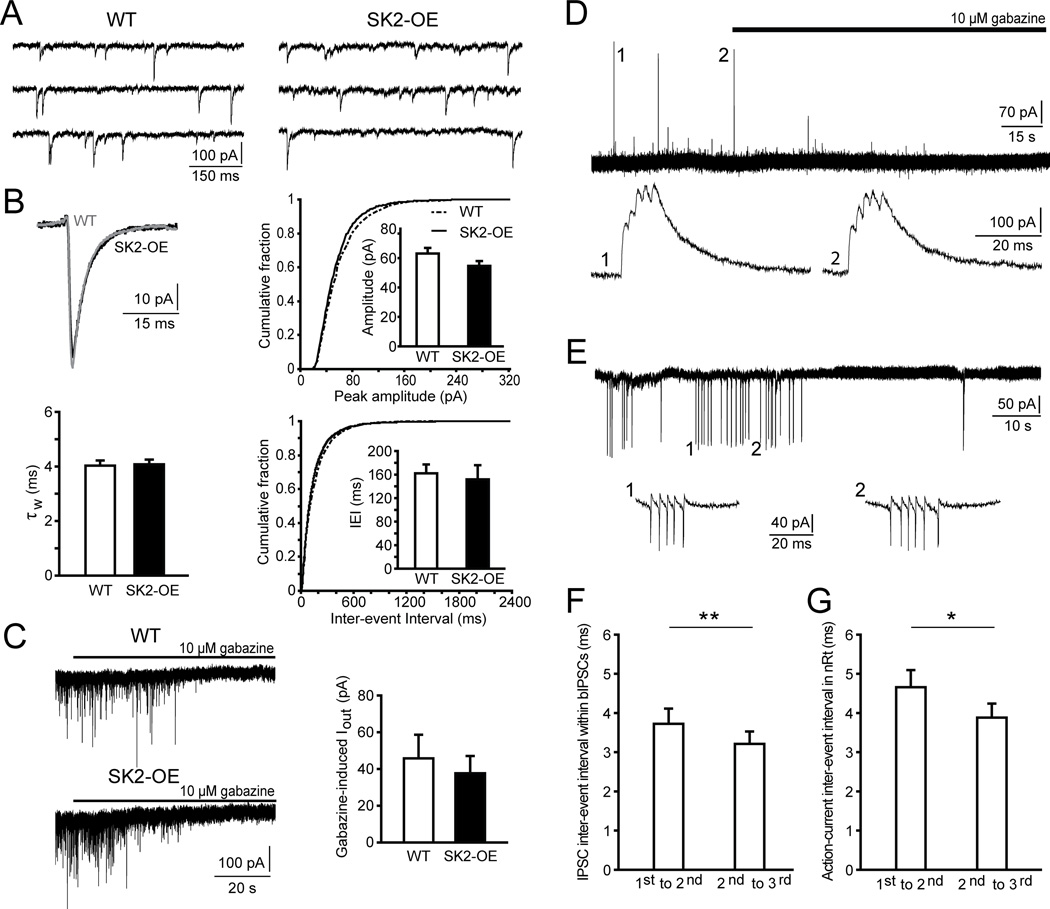
Figure 3.
Spontaneous IPSCs and tonic GABAergic currents are unaltered in SK2-OE TC cells. Moreover, unitary burst-mediated IPSCs (bIPSCs) can be detected in the absence of glutamatergic receptor blockers. A, Representative recordings of sIPSCs from a WT (left) and a SK2-OE (right) TC cell. B, (Upper left) Overlaid average sIPSC from a WT (grey) and a SK2-OE (black) TC cell, obtained through averaging at least 200 events aligned to their rise time. Bar graphs show mean values for weighted decay time constants τw (lower left), amplitudes (upper right) and inter-event interval (IEI) (lower right) of sIPSCs. Cumulative distributions are shown for amplitude and IEI (P > 0.05). C, Membrane holding currents recorded in DNQX (40 µM) and D,L-APV (100 µM) in a WT and a SK2-OE TC neuron clamped at −50 mV during gabazine application (10 µM), revealing a tonic current component that was comparable between genotypes (right: WT: n = 7; SK2-OE: n = 8; p > 0.05). D, Burst IPSCs occurring in a WT TC cell when blockers for glutamatergic transmission were omitted. Application of gabazine (10 µM) blocked all events. Events marked with a number are shown enlarged at the bottom, revealing that they arose from the temporal summation of closely spaced IPSCs, yielding the typical multi-peak waveform of burst-IPSCs (bIPSCs). E, Example trace of a cell-attached recording from a bursting nRt cell, producing high-frequency ACs. Traces marked with 1, 2 are shown enlarged at the bottom. F, G, Bar graphs show the time intervals between the first 3 temporally summated IPSCs in TC cells (F; n = 8; ** P < 0.01) and between the first 3 ACs of spontaneously bursting nRt cells (G; n = 7; * P < 0.05).

