Figure 5.
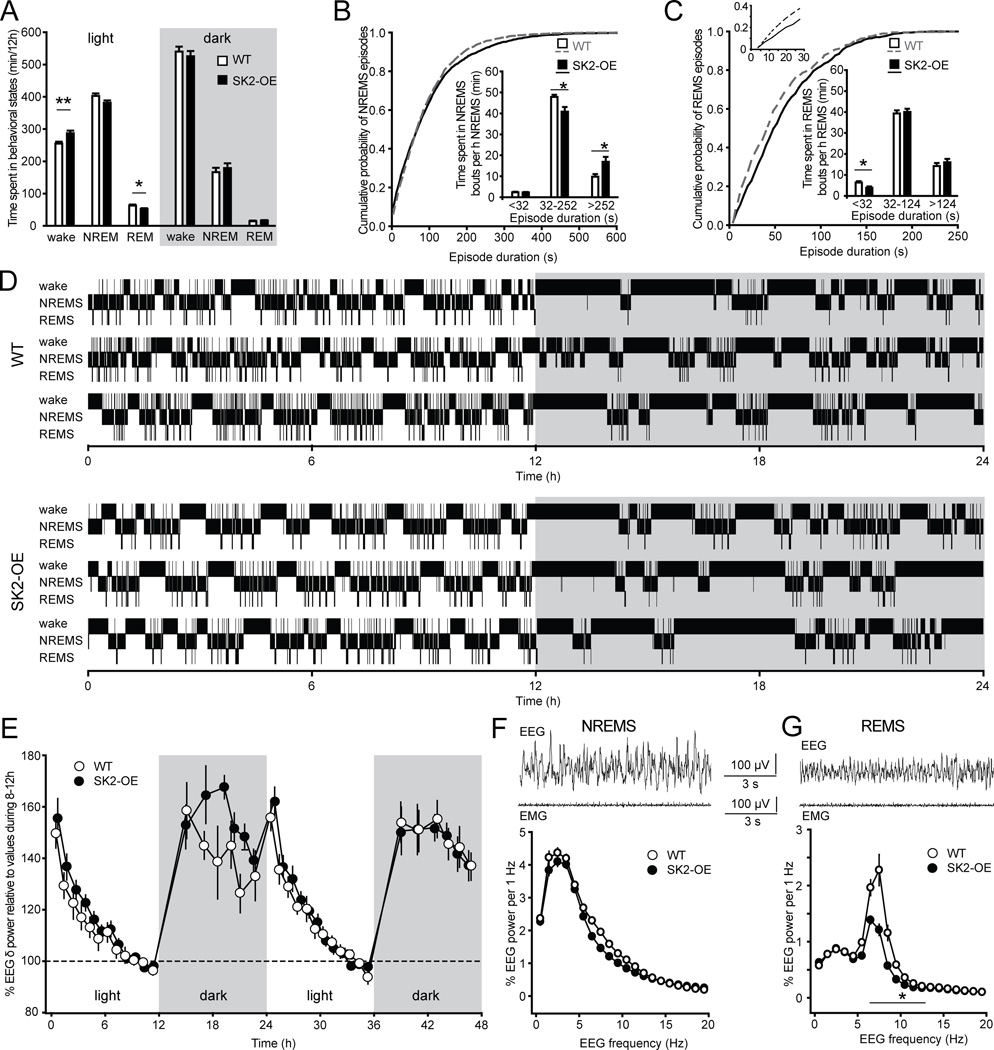
SK2-OE mice show consolidated NREMS without alterations in EEG δ power. A, Time spent in wake, NREMS (NREM), and REMS (REM) separated for the 12h light and dark periods (WT: n = 10; SK2-OE: n = 12). Repeated measures ANOVA revealed significant genotype × behavioral state interaction for the light (F(2,40) = 6.6, p < 0.01), but not for the dark (F(1.0,20.2) = 0.4, p > 0.05) phase. In the light period, SK2-OE mice spent similar amounts of time in NREMS (p > 0.05, post-hoc t-test), while REMS was reduced (*p < 0.05) and waking increased (**p < 0.01). B, C, Cumulative distributions of NREMS (B) and REMS (C) episode durations during light phase only. Insets show the time spent in short, intermediate, and long episodes per hour of corresponding sleep (* p < 0.05). Top left inset in C indicates that cumulative distributions for REMS episodes run in a non-parallel fashion for very short durations only, leading to the selective reduction of time spent in short (< 32 s) REMS episodes. D, Representative hypnograms for 3 WT and 3 SK2-OE mice across the first 24 h of EEG recordings. Gray shaded area represents the dark / active phase of the animals. E, Average EEG δ power (0.75 – 4 Hz) time course across 48 h, measured in undisturbed mice (WT: n = 10; SK2-OE: n = 12) entrained on a 12 h - 12 h light-dark cycle. Grey boxes mark the dark / active phase of the mice. Values are expressed relative to the average EEG δ power during hours 8 to 12. Repeated measures ANOVA indicated no genotype × time interaction (F(0.15, 5.22) = 1.12, P > 0.05). F, G Example EEG (top) and EMG (bottom) traces for NREMS (F) and REMS (G). Average relative EEG spectra for NREMS and REMS between 0.75 to 20 Hz (in 1 Hz bins, to allow for repeated measures ANOVA) are shown in the corresponding graphs. Repeated measures ANOVA indicated no genotype × frequency interaction in the NREMS EEG power spectrum up to 20 Hz (F(1.7, 33.5) = 1.2, p > 0.05), but significance was reached for the REMS spectrum (F(1.3, 25.9) = 7.4, p < 0.01). * indicates points with significant genotype difference (p < 0.05, post-hoc t-test).

