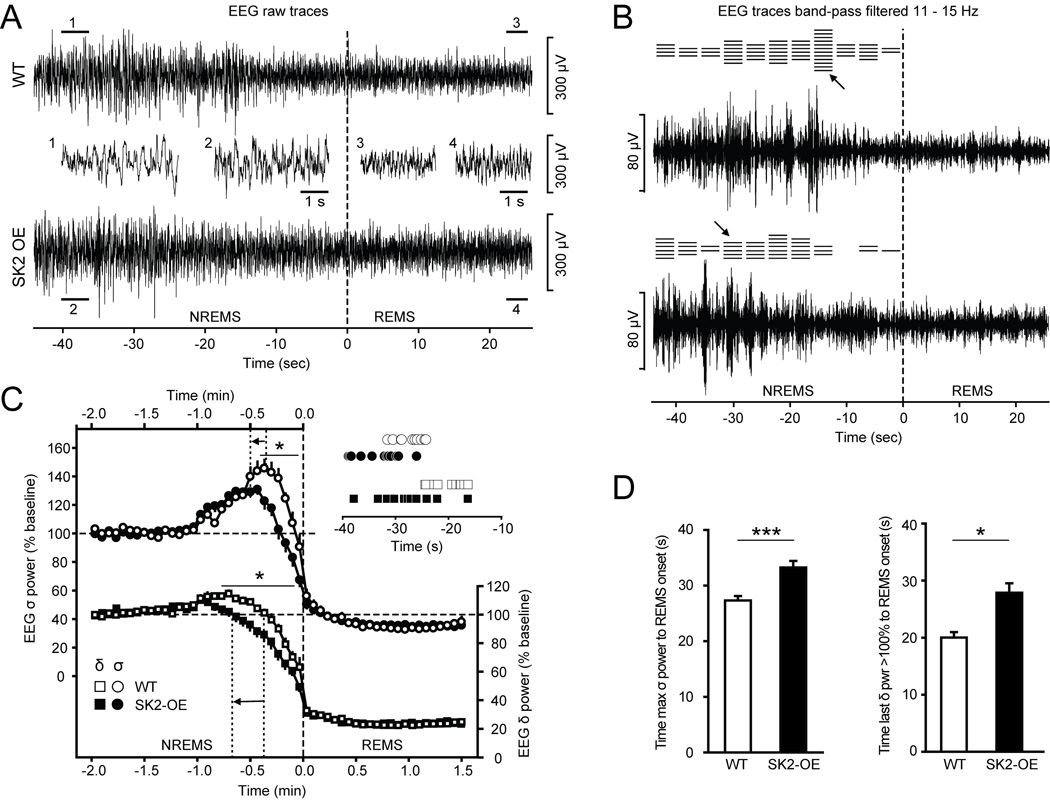
Figure 6.
SK2 over-expression impedes transitions out of NREMS. A, Example traces of raw EEG recordings at the transition from NREMS to REMS for WT (top) and SK2-OE (bottom). For better comparison, epochs marked by numbers (1 – 4) are shown in the middle at an expanded time scale. B, Same example NREMS-REMS transitions as in A, band-pass filtered at 11 – 15 Hz to reveal activity in the σ frequency band. Vertical dashed line denotes REMS onset, as determined by the appearance of EEG θ activity (together with the absence of muscle tone, not shown). Horizontal lines on top of the traces indicate the 4s-epoch containing the peak in σ power for all individual NREMS-REMS transitions of the mouse from which the representative trace was selected. Arrows mark the horizontal line corresponding to the data trace shown. C, Average EEG σ (11 – 15 Hz, left y-axis) and δ (0.75 – 4 Hz, right y-axis) power time course at NREMS-REMS transitions (WT: n = 10; SK2-OE: n = 12). Data are expressed as % baseline values during min −3 to −1 (−2 to −1 min are shown). Time points (4 s-epochs) with significant genotype differences are indicated by *. Dashed line marks REMS onset, while dotted lines denote the average time point of peak σ values and last δ power > 100% obtained from the averaged datasets. Arrows indicate the shift to longer transition times. To further demonstrate this prolongation of transition periods, the inset indicates mean latencies to REMS for individual mice, calculated from the σ band peak (top) or from the δ band (bottom). D, Bar graphs comparing the mean latencies from the NREMS σ peak to REMS onset (left, *** p < 0.001) and the time needed to down-regulate δ power from 100 % baseline levels to the beginning of REMS (right, * p < 0.05) based on single-transition analysis.

